Month End Offer : Get 30% OFF + $999 Study Material FREE - SCHEDULE CALL
Data Science is among the fastest expanding fields in every sector as a result of the ever-increasing variety of data sources and the resulting deluge of data. Using their subject-matter expertise in conjunction with their knowledge of mathematics, statistics, computer science, advanced analytics, AI, and machine learning, data scientists can extract useful information from an organization's database. Furthermore, these discoveries can enhance the decision-making process and strategy work.
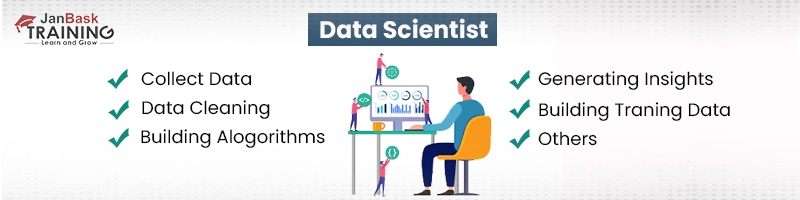
Insights that are pertinent to the situation can be gleaned by analysts with the help of the roles, tools, and processes that are included in the data science life cycle. The following procedures are typical for a project based on data science:
Ingestion of Data: The initial step in any data lifecycle is gathering of raw data whether structured or unstructured from various sources. This can be accomplished in different ways including human entry, web scraping, or the continuous streaming of information from a large number of different systems and devices. Unstructured data sources can include things like log files, video, audio, photos, the Internet of Things (IoT), social media, and more; structured data sources, on the other hand, might contain things like customer data. Unstructured data sources can be found in a variety of places.
Storing and Processing of data: The storage system that a business chooses should be carefully considered, as data can come in a wide variety of formats and architectures. Workflows for analytics, machine learning, and deep learning models are made easier with the use of standards established by data management teams. ETL (extract, transform, and load) jobs or other data integration technologies are used in cleaning, deduplicating, transforming, and combining the data at this step. The quality of the data loaded into a data warehouse, data lake, or other repository can be greatly improved with the help of this preparatory work.
Analysis of Data: Data scientists here undertake exploratory data analysis to look for anomalies and discover the data's biases, patterns, extremes, and distributions. Hypotheses for a/b testing can then be formulated based on the findings of this data analytics investigation. It also enables analysts to assess the usefulness of the data for modeling purposes in predictive analytics, machine learning, and/or deep learning. Organizations can grow more scalable if they come to rely on the insights provided by models, but this is contingent on the correctness of those models. Data scientists are highly in demand because they help in executing data mining techniques, making it a good career choice.
Communication: Insights are then provided to business analysts and other decision-makers in the form of reports and other data visualizations that make the insights, and their influence on the business, more clear. Data scientists can employ components built into programming languages like R and Python, or they might turn to specialized visualization tools.
Data scientists and data analysts often have overlapping skill sets, especially in areas like exploratory data analysis and data visualization. A data scientist's expertise, however, is often more comprehensive than that of a data analyst. Common programming languages in data science like R and Python are used for increased statistical inference and data visualization. A data scientist is someone with a genius mind and highly demanded technical expertise.
This can be answered as someone who needs expertise in computer science and pure science beyond that of a standard business analyst or data analyst to complete these jobs. The data scientist should know about data science from scratch and also be familiar with the company's industry, processes, and goals.
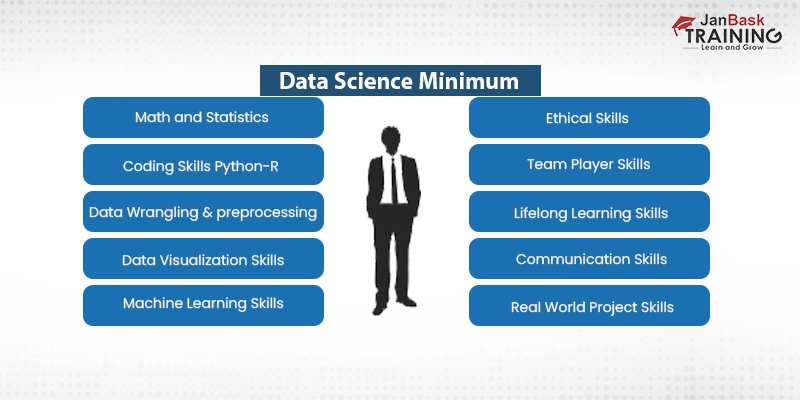
In order to succeed as a data scientist, one needs to be adept at:
A lot of people are confused about the role of a Data Scientist and a Data Analyst, even though both deal with “Data” still there are a good number of significant differences between them. Do you want to know the precise difference between a data scientist and a data analyst, then click here.
Knowing about data science should begin with creating an understanding of its heavy reliance on statistical methods. The study of statistics encompasses a very large amount of data and can be helpful in a wide number of contexts. For a career in data science, having a solid foundation in statistics is absolutely necessary. The following is a collection of the essential statistical concepts that serve as the basis for data science:
1. Statistical Descriptions
The purpose of descriptive statistics is to aid in the analysis of raw data in order to extract the most important and relevant aspects. In order to make the data more accessible, descriptive statistics can be used to create graphical representations of the information. Unlike inferential statistics, it aids in making sense of the data through the use of graphs. In contrast, statistical inference are used to draw conclusions from data.
2. The Law of Likelihood
Probability theory is the mathematical study of the possibilities of outcomes in random situations. It is possible to estimate the odds of drawing a red ball from a bag of colored balls by tossing a coin. The range of values for probability is 0-1 and it is always between 0 and 1. If the probability is high, then the event will most likely occur.

Data Science Training
Various probabilities exist for various events. Two or more occurrences of the same event that are not dependent on or related to one another are referred to as "independent events" when they are discussed using the term "independent events." A conditional probability is the likelihood of an occurrence given its relationship to another event. This concept can be found in the field of probability theory.
3. Reduced Dimensions
By decreasing the number of dimensions in a dataset, many issues that were previously intractable can now be solved. This is because the high dimensional data set contains numerous features, necessitating the generation of additional samples to account for each possible permutation.
Because of this, analyzing data has become much more complicated. In light of this, it is clear that the dimensionality reduction approach is the key to solving all of these issues while also providing numerous advantages.
4. A Data Set's Central Tendency:
5. Verifying Through Hypothesis Testing
The purpose of a hypothesis test is to examine a survey's findings. In hypothesis testing, there are two sorts of hypotheses: the null hypothesis and the alternative hypothesis. To state it another way, the null hypothesis is the broad assertion that is unrelated to the phenomenon under study. A statement that directly contradicts the Null hypothesis is called the Alternate hypothesis.
6. Significance Tests
The significance test is a series of tests used to verify the correctness of the hypothesis in question. Some of the tests that can be used to accept or reject the Null Hypothesis are listed below.
The probability value used to test whether or not the null hypothesis is valid is called the "P-value". The Null Hypothesis is true if and only if the p-value is larger than a critical threshold. If the p-value is less than a threshold number, then we reject the Null Hypothesis. The value 'a' here is a significant number very close to zero. The fifth test is called the Z-test, and it's used to verify the Null Hypothesis. When two populations have distinct means and either their variances are known or the sample size is large, this method can be utilized.
When either the population variance is unknown, or the sample size is limited, researchers turn to a t-test, a type of statistical test.
7. Sampling
Sampling is the branch of statistics concerned with the selection, analysis, and interpretation of information drawn from a statistically representative sample of a larger population. We use under and over-sampling methods if we believe the data is insufficient to achieve the interpretations. Data can be under-sampled by excluding unnecessary information and over-sampled by simulating the distribution of a real population.
8. Bayesian Statistics
The Bayes Theorem is the foundation of this statistical technique. Through the use of previous conditions, Bayes' theorem establishes a formula for calculating the likelihood of an event. Therefore, the Bayesian approach uses prior evidence to calculate the likelihood. Conditional probability, or the likelihood of an event occurring given a set of assumptions, is defined by Bayes's Theorem as well. Data science tutorial will help you to explore the world of data science and prepare to face the challenges.
Data scientists rely heavily on Python as their primary programming language of choice. Calculations and analyses can be made more straightforward thanks to the integration of several mathematical libraries and functions into the Python programming language.
Data science in python relies upon the use of its libraries. The following Python libraries provide access to extensive sets of mathematical and analytical tools.
1. Pandas: Use the Pandas library to do structured data operations like importing CSV files, making data frames , and performing data preparation.
2. Numpy: Here's a mathematics library called Numpy. Includes useful tools like linear algebra, the Fourier transform, and an N-dimensional array object.
3. Matplotlib: Data visualization is made possible with the help of the Matplotlib library.
4. Scientific Python (ScPy): This library has a collection of codes that include linear algebra modules.
Some Features of Python are:
Data science is crucial because it integrates various approaches, techniques, and technologies in order to derive insights from data. A plethora of devices that can automatically gather and retain information has led to a data deluge in today's businesses. In the realms of e-commerce, medicine , and finance, as well as every other facet of human life, more data is being captured thanks to online systems and payment portals.
In order to assess consumer and market patterns, financial risks, cyber security concerns, stock trades, equipment maintenance needs, and medical issues, data scientists must frequently work with massive amounts of data as part of data science efforts. At JanBask, we provide a self learning data science guide, to business executives on how to improve the company's operations, goods, or services; a data scientist must have a firm grasp of both the data and the business.
To learn about data science in Python, sign up for our Data Science training course.

Basic Statistical Descriptions of Data in Data Mining
 May 11, 2023
  12.2k
12.2k
What is Model Evaluation and Selection in Data Mining?
Mar 28, 2023 12.2k

Rule-Based Classification in Data Mining
Mar 27, 2023 11.8k
Gen AI

Agentic AI

AI in Automation Testing

Cyber Security

Data Science

QA

Salesforce Service Cloud

AWS
Download Syllabus
Get Complete Course Syllabus
Enroll For Demo Class
It will take less than a minute
Tutorials
Interviews
You must be logged in to post a comment


