Month End Offer : Get 30% OFF + $999 Study Material FREE - SCHEDULE CALL
Data science is a field that involves the use of various techniques to extract insights from data. One such technique is clustering, which involves grouping similar data points together based on some criteria. There are several types of clustering algorithms available in data science, and one popular algorithm is k medoids clustering.K medoids clustering, also known as partitioning around medoids (PAM), is an unsupervised learning algorithm used for cluster analysis. It is an extension of the k-means algorithm and has been widely used in different fields such as biology, finance, marketing, and social sciences.
In this blog post, we will explore what k medoids clustering is all about and how it differs from other clustering algorithms like k means. We will also look at how to implement k medoids using Python's scikit-learn library. For an in-depth understanding of the k-medoids clustering algorithm, our Data scientist course online helps you explore more about k medoids clustering, the most effective tool of data science.
K medoids clustering is a popular data mining and machine learning technique. This algorithm is particularly useful when dealing with large datasets, as it can efficiently group similar data points into clusters.One of the primary advantages of K medoids clustering over other methods is its ability to handle noisy or incomplete data. Since the representative objects (medoids) are actual observations themselves, they are less likely to be affected by outliers or missing values that could skew results in centroid-based approaches like K-means.Let's consider an example to understand better how K medoids clustering works. Suppose you have a dataset containing customer information for an online retailer. Each row represents a different customer, and each column contains information such as age, gender, location, purchase history, etc.Using K medoids clustering on this dataset would involve selecting k number of initial cluster centers (medoids), where k represents the desired number of clusters. These centers can be chosen randomly or using a hierarchical clustering method.Next, each observation in the dataset is assigned to its closest cluster center based on some distance metric (e.g., Euclidean distance). The distances between each observation and its corresponding cluster center are then calculated and summed up for all observations within that cluster.
The next step involves swapping out one of the existing medoids with another observation from that same cluster and recalculating the sum of distances for all observations within that new configuration. This process continues until no further improvements can be made by swapping out any more medoids.We have our final set of k clusters with their respective representative objects (medoids). These clusters can now be analyzed further to gain insights into customer behavior patterns or other trends within our data.In summary, K medoid clustering offers several advantages over traditional centroid-based methods like K-means due to its ability to handle noisy or incomplete data while producing more accurate overall results. By restricting representatives only to actual observations themselves, K medoids clustering provides a more robust and reliable approach to clustering analysis.
K medoids clustering is a popular and effective data clustering method used in various applications such as image segmentation, customer segmentation, and anomaly detection. The main difference between K medoids clustering and other types of clustering algorithms like K-means or hierarchical clustering is that it uses actual data points (called medoids) to represent each cluster instead of calculating the mean or centroid.
To understand how this algorithm works, let's consider an example where we have a dataset with 1000 observations on two variables: age and income. Our task is to group these observations into 'k' clusters based on their similarities.
Step 1: Selecting Initial Medoid Points
We start by selecting 'k' number of random data points from our dataset as our initial medoid points. Let's say we choose k=3 for this example, so we randomly select three data points from our dataset as our initial medoids.
Step 2: Assigning Non-Medoid Points to The Nearest Medoid
Next, we assign each non-medoid point in the dataset to its nearest medoid based on some distance metric (e.g., Euclidean distance). This means that every observation in the dataset will be assigned to one of the three selected initial centroids based on which centroid they are closest to.
Step 3: Calculating Total Cost
After assigning all non-medoid points to their respective centroids, we calculate the total cost function for each cluster using some distance measure (e.g., summing up distances between all non-medoids assigned within the same centroid). This cost function represents how well all data points within the same centroid are clustered together.
Step 4: Swapping Non-Mediod Points with Current Selected Mediod
Now comes an iterative process where we try swapping one non-medoid point at a time with one current selected mediod at a time until there's no further decrease in cost function i.e. when the overall cost function is minimized. This process helps us find better medoids within each cluster, improving our clustering accuracy.
Step 5: Repeat Until Convergence
Finally, we repeat steps 2-4 until convergence i.e., when there's no further improvement in the cost function or changes in clusters occur.
In summary, K medoids clustering works by selecting initial random data points as medoids and then iteratively assigning non-medoid points to their nearest centroids while trying out different combinations of swapping selected medoids with a non-medoid point to minimize the overall cost. By following these steps, we can group similar observations into the 'k' number of clusters based on their similarities and differences.

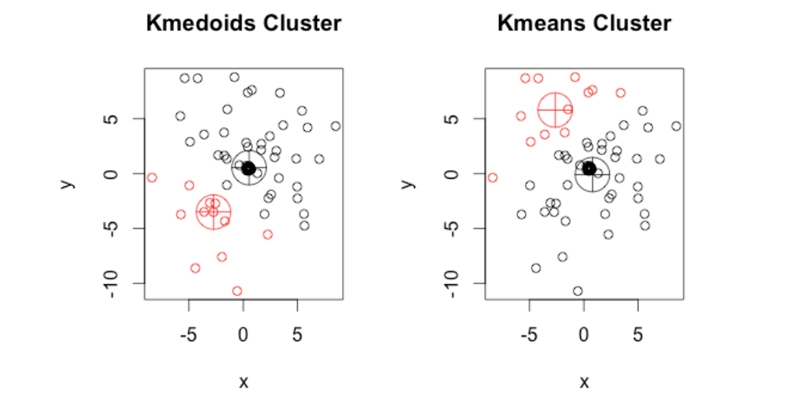
K-means clustering is a commonly used algorithm for partitioning data into k clusters based on their similarity. The algorithm works by randomly selecting k centroids and then assigning each point in the dataset to its nearest centroid. The centroid is then updated as the mean of all points assigned to it, and this process continues until convergence.One limitation of k-means clustering is that it assumes that the centroid of each cluster can be any point within the cluster. This means that if there are outliers in a particular cluster, they could affect the position of the centroid leading to suboptimal results.
K-medoid clustering, also known as Partitioning Around Medoids (PAM), overcomes this limitation by using actual observations themselves instead of centroids as representatives or medoids for each cluster. In other words, rather than computing an average value for all points assigned to a given cluster, like in K-means clustering, we select one observation from our dataset that best represents that group.This approach makes K-medoid more robust against noise and outliers since it selects only actual observations as representatives; therefore, outliers do not have much effect on them. Additionally, unlike K means, where the distance between data points is usually measured using Euclidean distance metric, which may not always work well when dealing with categorical variables or non-linear relationships between variables, K medoid allows us to use different dissimilarity measures such as Manhattan distance or cosine similarity depending on our problem requirements.
For instance, consider a scenario where we want to segment customers based on their purchase history and demographic information such as age and gender. Suppose some customers have significantly higher spending habits than others due to exceptional circumstances like buying gifts during holiday seasons or making bulk orders occasionally. In that case, these high spenders will appear far away from other customers, thus affecting how clusters are formed under the k-means algorithm. Still, we can expect better clustering results, thanks to K-medoids' ability to pick representative medoids from existing data points without considering outlier data points.
While K-means is a widely used algorithm for cluster analysis, it has some limitations that can be overcome using K-medoid. The use of actual observations as representatives rather than centroids makes K-medoid more robust against noise and outliers. Moreover, the ability to choose different dissimilarity measures in K-medoid allows us to tailor our approach based on specific requirements or dataset characteristics.
Implementing K Medoids Clustering Using Python's Scikit-Learn Library
Python provides various libraries for machine learning tasks such as scikit-learn, including several modules for different unsupervised learning algorithms, including K-Medoids.
To implement K-Medoids using Python's scikit-learn library, we need first to install this package by running !pip install -U scikit-learn command on your terminal or Jupyter notebook environment, then import the necessary modules:
```

from sklearn_extra.cluster import KMedoids

from sklearn.datasets import make_blobs

import matplotlib.pyplot as plt

```
After importing the necessary packages and generating data points with the make_blobs function from sklearn.datasets module, we can create our model instance by specifying number clusters (k) and metric distance measure:
```

model = KMedoids(n_clusters=3,distance_metric='euclidean')

model.fit(X)

y_pred = model.predict(X)

```
Finally plotting our result using Matplotlib library:
```

plt.scatter(X[:,0], X[:,1], c=y_pred)

plt.show()

```
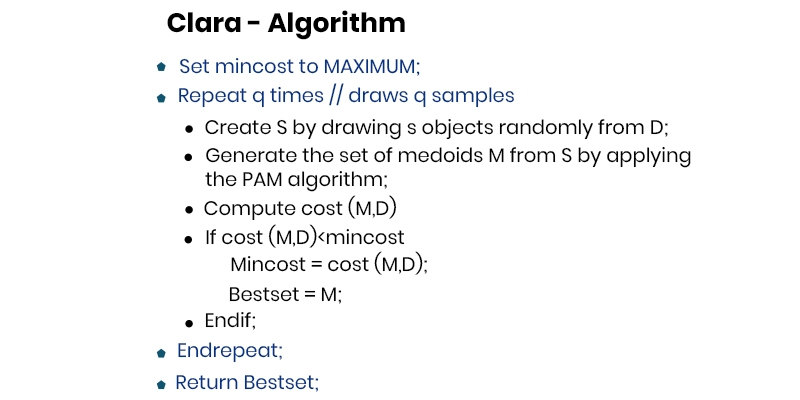
Although PAM algorithms easily employ k-medoids to partition data on smaller sets, they struggle when it comes to scaling up. However, a sampling-based method called CLARA (Clustering LARge Applications) can handle larger volumes of data.
CLARA works by selecting a subset of data for analysis instead of studying the entire collection. The basic concept involves randomly sampling the dataset and using PAM algorithms to choose medoids from this pool. This way, selected items will likely reflect what would have been chosen if we had studied all objects in the dataset.
We can return with an optimal clustering solution by repeating this process several times and applying PAM algorithms each time. It's no surprise that CLARA performs better than PAM when dealing with huge amounts of data since its complexity per iteration is O(ks2 +k(nk)), where s represents sample size, and k denotes number clusters. At the same time, n refers to the total objects in our database.
Based on experimental evidence, it has been determined that CLARANS outperforms both PAM and CLARA. By utilizing a silhouette coefficient to gauge an object's degree of belonging to a cluster, the most "natural" number of clusters can be identified. Additionally, CLARANS is capable of identifying anomalies. However, it should be noted that its computational complexity is approximately O(n 2 ), where n represents the total number of items, and the quality of its grouping may be influenced by the sampling technique employed. To improve CLARANS' ability to handle data objects on disc, incorporating spatial data structures like R*-trees would prove beneficial.
K-medoids have various advantages of using clustering algorithms in data science. Here are a few of the advantages of using the k-medoids clustering algorithm:
Despite having huge advantages of using k medoids, it also comes with a few limitations mentioned below:
Despite these limitations, K-medoid clustering has several real-world applications where it's commonly used:

Data Science Training
K medoids clustering is a powerful unsupervised learning algorithm for cluster analysis. It differs from other clustering algorithms like k means in that it restricts representatives only to be actual observations themselves and handles outliers differently.
Python's scikit-learn library provides an easy way to implement k-medoid clustering, making it accessible to data scientists of all levels. By understanding the basics of k-medoid clustering and how to implement it using Python, you can start exploring your datasets and extracting valuable insights from them. You can also learn about neural network guides and python for data science if you are interested in further career prospects in data science.

Basic Statistical Descriptions of Data in Data Mining
 May 11, 2023
  12.1k
12.1k
What is Model Evaluation and Selection in Data Mining?
Mar 28, 2023 12.1k

Rule-Based Classification in Data Mining
Mar 27, 2023 11.7k
Gen AI

Agentic AI

AI in Automation Testing

Cyber Security

Data Science

QA

Salesforce Service Cloud

AWS
Download Syllabus
Get Complete Course Syllabus
Enroll For Demo Class
It will take less than a minute
Tutorials
Interviews
You must be logged in to post a comment


