Month End Offer : Get 30% OFF + $999 Study Material FREE - SCHEDULE CALL
Data science is a rapidly growing field that involves extracting insights and knowledge from data. One of the most important tasks in data science is identifying patterns and structures within datasets. Clustering is a popular technique for grouping similar objects based on their attributes or features. However, traditional clustering algorithms can be limited when dealing with large datasets or complex structures.
The optics clustering algorithm efficiently identifies clusters in large datasets by ordering points based on their density and distance. This blog post will explore how optics clustering works and its applications in data science. Let's dive more into the topic of OPTICS methods and learn more about their importance in data mining and key takeaways. You should check out the data science certification courses online to improve your basic concepts.
OPTICS stands for Ordering Points To Identify Cluster Structure, which means it orders points based on their density reachability distance. The algorithm starts by defining two parameters - epsilon (ε) and minPts (minimum number of points). Epsilon defines the maximum radius around each point to be considered when calculating its density reachability distance. At the same time, minPts specifies the minimum number of neighboring points required to form a cluster.Optics clustering is a data analysis technique that helps identify clusters in large datasets. This method is particularly useful when dealing with complex and non-linearly separable datasets where traditional clustering algorithms may not work effectively.
One important parameter in Optics clustering is epsilon (ε), which defines the maximum radius around each point that should be considered when calculating its density reachability distance. A larger epsilon value will result in more points being included in each cluster, while a smaller value will create tighter and more isolated clusters.Another key parameter is minPts, which specifies the minimum number of neighboring points required to form a cluster. Points with fewer than minPts neighbors are classified as noise or outliers and excluded from any identified clusters.
Optics clustering works by first calculating pairwise distances between all data points using Euclidean distance or any other suitable metric. Then it computes local densities for each point using a kernel function such as the Gaussian kernel or Epanechnikov kernel.Next, it identifies core samples as those whose local density exceeds some threshold value set by ε parameter and has at least minPts neighbors within ε radius around them. Non-core samples are those whose local densities do not exceed ε but are within ε radius of a core sample.Once the core samples and non-core samples have been identified, the algorithm begins forming clusters.
The first cluster is formed by selecting a core sample and then recursively adding all directly reachable points from that sample until no more points can be added.The next cluster is formed by selecting another unassigned core sample and repeating the process. If no more unassigned core samples exist, the remaining non-core samples are assigned to their nearest core sample if it falls within ε radius.Optics clustering also allows for flexible parameter tuning. The ε parameter controls how close data points must be to each other to be considered part of the same cluster, while minPts controls how many neighbors a point must have to be considered a core sample.One advantage of Optics clustering over traditional clustering algorithms like K-means or hierarchical clustering is that it can detect clusters with arbitrary shapes and sizes. It also does not require specifying the number of clusters beforehand as it forms them based on density connectivity.For example, consider a dataset containing customer transactions at a retail store. Optics clustering could identify groups of customers who make similar purchases or visit the store around the same time periods, even if they do not fall neatly into pre-defined categories like "frequent shoppers" or "weekend visitors." This could help retailers better understand customer behavior patterns and tailor marketing strategies accordingly.
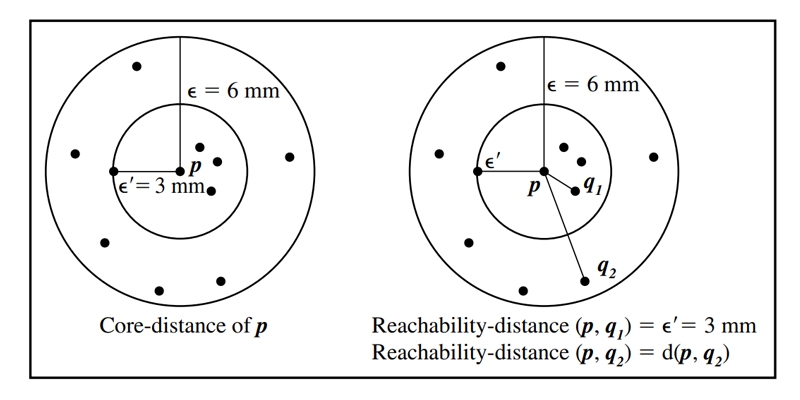
The distance between the center and the nearest point that can be reached. Let's say for the sake of argument that MinPts equals 5 and 6 mm. Its core distance is defined as the distance between point p and the 0th data item that is geographically closest to it. Because the core distance of point p (i.e., 0 = 3 mm) is greater than the Euclidean distance between point p and point q1, we may conclude that point q1 is within reach from point p. Given that the Euclidean distance from point p to point q2 is more than the core-distance of point p, we will refer to this distance as the reachability-distance of point q2 about point p.
The OPTICS algorithm organizes the data in a database by sorting it according to a core distance and a reachability distance that is appropriate for each item. To make use of the ordering information that was provided by OPTICS, a strategy that was recommended to extract clusters was devised. This small amount of data is sufficient to enable the extraction of any density-based clusterings concerning a distance 0 that is less than the distance that was used to produce the order.When analyzing and better understanding a particular data set, a graphical depiction of the cluster ordering of the data collection may be helpful. Reachability plots, a simple two-dimensional data set, offer high-level insights into the structure and clustering of the data. The data items and the associated reachability distances are presented below (vertical axis) in horizontal cluster order. The data set has three unique groups, each of which is illustrated by a separate "bump" or Gaussian distribution in the plot. These distributions may also be thought of as "bumps." Because of recently established approaches, the clustering structures of high-dimensional data may be observed in varied degrees of depth. This is possible because of the presence of these methods.

Because the OPTICS and DBSCAN algorithms are fundamentally equal, the runtime complexity of the OPTICS algorithm is identical to that of the DBSCAN method whenever a spatial index is used (where n is the number of objects).Clustering based on optical versus clustering based on discrete background scans (DBSCAN) The OPTICS clustering approach uses a priority queue called the Min Heap to locate the next data point, which is Reachability Distance-wise, the closest to the point currently being processed. However, doing so incurs an additional memory cost. More processing power is required because searches involving the nearest neighbor in DBSCAN are more complicated than queries involving a radius.
Fewer Parameters: The OPTICS clustering method does not need the use of the epsilon parameter; rather, its inclusion in the pseudo-code presented above was done to conserve space. As a result, the analytical labor required in determining the best possible values for the parameters is made easier. You can learn the six stages of data science processing to grasp the above topic better.When employing this approach, the data are not organized in any way, including being sorted or clustered. This technique just produces a Reachability distance plot. Therefore, it is up to the programmer's imagination to decide how the data points should be grouped.
For each item in a cluster, density-based clustering requires that its neighborhood within a specified radius () include at least a minimum number of objects (MinPts) or that the cardinality of the neighborhood is greater than some threshold. This article briefly introduces the formal definitions behind the concept of clustering. See for a more in-depth explanation.
First, we'll Define: (Directly Density-Reachable)
If (and only if) (1) p N(q) (where N(q) is the subset of D included in the -neighborhood of q), then p is directly density-reachable from q concerning and MinPts in the set of objects D.
The core object condition is defined as Card(N(q)) MinPts, where Card(N) is the cardinality of the set N. If p satisfies this criterion, we refer to p as a "core object." Density-direct access to items outside their cores is only possible from those objects.
Second Definition: (Density-Reachable)
For every two objects p and q in the set of objects D, if there is a sequence of objects p1,..., pn, p1 = q, pn = p, then pi D and pi+1 is directly density-reachable from pi wrt. and MinPts.The density-reachability hull is the transitive closure of the direct density-reachability hull. In most cases, symmetry cannot be assumed in this relationship. Density-reachable proximity is only possible between central objects.
Thirdly, We Define It As: (Density-Connected)
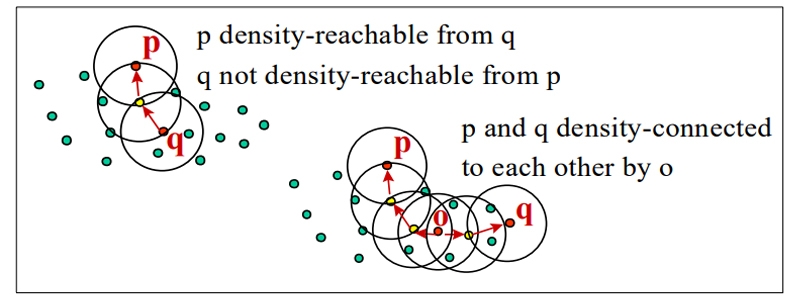
If there is a single object o D such that both p and q are density-reachable from o wrt. and MinPts in the set of objects D, then p and q are density-connected concerning MinPts.In terms of density and connection, we have a completely symmetrical relationship. An example database of 2-dimensional points in a vector space may be applied to data in a metric space with the addition of a distance measure.By this definition, a density-based cluster is a maximum set of density-connected objects for density-reachability. In contrast, noise is the set of objects that do not belong to any cluster.
# Sample code to create OPTICS Clustering in Python
# Creating the sample data for clustering
from sklearn.datasets import make_blobs
import matplotlib.pyplot as plt
import numpy as np
import pandas as pd
# create sample data for clustering
SampleData = make_blobs(n_samples=100, n_features=2, centers=2, cluster_std=1.5, random_state=40)
#create np array for data points
X = SampleData[0]
y = SampleData[1]
# Creating a Data Frame to represent the data with labels
ClusterData=pd.DataFrame(list(zip(X[:,0],X[:,1],y)), columns=['X1','X2','ClusterID'])
print(ClusterData.head())
# create a scatter plot to visualize the data
%matplotlib inline
plt.scatter(ClusterData['X1'], ClusterData['X2'], c=ClusterData['ClusterID'])
##################################################################################
# This function is not present in Python version 3.6
# Another option is clustering. cluster. optics but it's not neat
from sklearn.cluster import OPTICS
op = OPTICS(min_samples=40, xi=0.02, min_cluster_size=0.1)
# Generating cluster id for each row using the DBSCAN algorithm
ClusterData['PredictedClusterID']=op.fit_predict(X)
print(ClusterData.head())
# Plotting the predicted clusters
plt.scatter(ClusterData['X1'], ClusterData['X2'], c=ClusterData['PredictedClusterID'])
Optics clustering has many applications in data science, including:
Optics clustering has a wide range of applications within data science domains due to its ability to analyze complex datasets quickly and accurately while providing insights into underlying patterns and relationships among data points.
Data Science Training For Administrators & Developers

Optics clustering is an efficient and effective way to identify clusters in large datasets with complex structures. It provides valuable insights into the underlying patterns and relationships within data that can be used for various applications such as image segmentation, customer segmentation, fraud detection, and more.By understanding how optics clustering works and its applications in data science, you can leverage this powerful technique to extract meaningful insights from your datasets and make informed decisions based on those insights. Understanding OPTICS in data mining begins with understanding data science; you can get an insight into the same through our data science certification courses.

Basic Statistical Descriptions of Data in Data Mining
 May 11, 2023
  12k
12k
What is Model Evaluation and Selection in Data Mining?
Mar 28, 2023 12k

Rule-Based Classification in Data Mining
Mar 27, 2023 11.6k
Cyber Security

QA

Salesforce

Business Analyst

MS SQL Server

Data Science

DevOps

Hadoop

Python

Artificial Intelligence

Machine Learning

Tableau
Download Syllabus
Get Complete Course Syllabus
Enroll For Demo Class
It will take less than a minute
Tutorials
Interviews
You must be logged in to post a comment


