Independence Day Deal : Upto 25% off on live classes - SCHEDULE CALL
The approach of supervised machine learning may be classified under one of two primary categories: either the category of classification algorithms or the category of regression algorithms. In the past, we have been successful in predicting outcomes with continuous-valued data by utilizing regression algorithms. However, in order to achieve the same results with discrete-valued data, we need to use classification methods. For better understanding of classification in data mining, the understanding data science is crucial; you can get an insight into the same through our Data Science Training.
The classification algorithm is applied to the new observations in order to establish their classification in relation to the training set. This methodology may be thought of as a form of Supervised Learning. First, in the process of classification, software learns from a dataset or collection of observations, and then it applies what it has learned to classify new observations. You are familiar with this type of question: "yes" or "no," "zero" or "one," "spam" or "not spam," "cat" or "dog" Targets/labels/categories are all names for classes.
In classification, as opposed to regression, the output variable is a category rather than a numerical value. For instance, in classification, the output variable may be "Green or Blue," "Fruit or Animal," etc. The classification algorithm, which uses the supervised learning method, requires labelled input data, which comprises the input as well as the output that is connected with it.
Data scientists frequently make use of a classification approach in order to organise the material they are working with into manageable groupings when they are dealing with enormous volumes of data. This strategy, which may be applied to both structured and unstructured data, is used to make predictions on the category or class into which incoming data will fall.
Binary classification assigns each piece of information to one of two groups (yes/no, good/bad, high/low, sickness status, etc.). A visual illustration of a categorization model may be found below; in this model, the gaps between categories are represented by solid lines. The line that divides the classes would exhibit different qualities, depending on the nature of the problem at hand and whether or not the underlying data exhibited linearity (present or absent).
Binary classification works on a liner model of algorithm:
Out of these algorithm, Logistic regression and support vector machine was exclusively designed for Binary classification, and as the name suggest, they cannot by default support more than two classes.
To know why and how to pursue a career in data science, refer to the data science career path.
If a classification problem has more than two outcomes, then it is called as Multi-class Classifier or Multinomial.Text analysis software may be able to complete tasks such as aspect-based sentiment analysis and the classification of unstructured text according to subject and polarity of opinion with the assistance of the algorithms designed specifically for this approach. In data science, there are normally five different classification methods that are used, as we shall see in a moment.
Multi-class, or multinomial, classifiers works on a non-linear algorithm model.
Accuracy is the conventional method of evaluating classification models. Accuracy is defined as the proportion of correctly classified examples over the whole set of examples.
Accuracy = (Number of correct predictions) / (Overall number of predictions)
Accuracy is very easy to interpret, which is why novices tend to favor it over other methods. In practice, it is only used when the dataset permits it. It is not completely unreliable as a method of evaluation, but there are other, and sometimes better, methods that are often overlooked.
When you only use accuracy to evaluate a model, you usually run into problems. One of which is evaluating models on imbalanced datasets.
Let's say you need to predict if someone is a positive, optimistic individual or a negative, pessimistic individual. If 90% of the samples in your dataset belong to the positive group, and only 10% belong to the negative group, accuracy will be a very unreliable metric. A model that predicts that someone is positive 100% of the time will have an accuracy of 90%. This model will have a "very high" accuracy while simultaneously being useless on previously unseen data.
Because of its shortcomings, accuracy is often used in conjunction with other methods. One way to check whether you can use accuracy as a metric is to construct a confusion matrix.
Confusion matrices are an alternate name for error matrices. It takes the form of a table and outlines the inconsistencies that can be found between the predicted classes and the actual ones. The comprehension of confusion matrices is of utmost importance with regard to the comprehension of classification metrics like recall and accuracy. Real numbers are placed in the rows of a confusion matrix, while predicted numbers are placed in the columns. In this instance, I'll illustrate what a confusion matrix that divides people into positive and negative categories may look like for you to consider using.
|
|
Predicted Value |
||
|
Positive |
Negative |
||
|
Real Value |
Positive |
TP |
FP |
|
Negative |
FN |
TN |
|
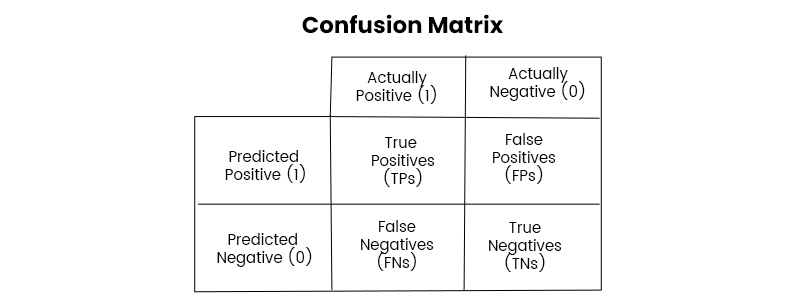
True Positive (TP): you predicted positive, the real value was positive
True Negative (TN): you predicted negative, the real value was negative
False Positive (FP): you predicted positive, the real value was negative
False Negative (FN): you predicted negative, the real value was positive
ACCURACY = TP+TNTotal Population
Within the scope of this discussion, the phrases "Area Under the Curve" (AUC) and "Receiver Operating Characteristics Curve" (ROC curve) are used in the same way.
It is a graphical depiction of the effectiveness of the classification model at a number of different cutoffs.As a graphical representation of the accuracy of the multi-class classification model, we make use of the Area Under the Curve, also known as AUC-ROC.When plotting the ROC curve, the True Positive Rate is found along the Y-axis, while the False Positive Rate is found along the X-axis.
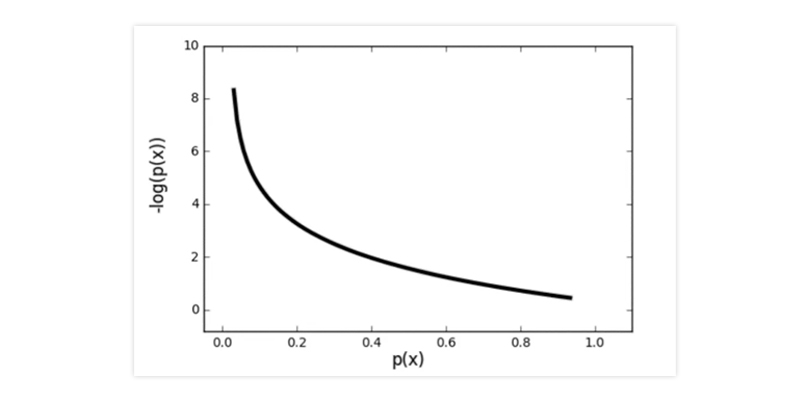
When working with difficulties of binary classification, binary cross-entropy is useful. A alternative name for binary cross-entropy is log loss. It is mostly used in neural networks as a measure. Uncertainty in making forecasts is taken into account by binary cross-entropy. The degree to which a forecast deviates from the true label is taken into account. This improves the model's performance and output, but it also makes it more vulnerable to issues caused by unbalanced data. Modifying binary cross-entropy is necessary when working with unbalanced datasets. The quality of your model can't be properly evaluated without including a class weight or other restriction.
Use the categorical cross-entropy method whenever you are dealing with a problem that involves a number of different classes. Cross entropy, when expressed in the binary form, generalises very well to problems involving several classes. This underlying idea is referred to as categorical cross-entropy in our dictionaries. Because of this, the benefits and drawbacks of use categorical cross-entropy are equivalent to those of utilising binary cross-entropy.

Data Science Training
As a final observation, knowledge of classifications is vital for individuals interested in science and technology, mainly those involved with big data analytics, machine learning, and artificial intelligence applications. Knowing how these systems work together can help improve efficiency and productivity while reducing errors made during analyses, ultimately leading to better decision-making processes. So, next time you come across something new, try classifying it using the principles mentioned above. You can explore how much more comfortable life becomes when everything has its place and is organized. You can also check out our career path for data science to understand more about the skills and expertise that can help you boost your career in data science.

Basic Statistical Descriptions of Data in Data Mining
 May 11, 2023
  10.8k
10.8k Mar 03, 2023 10.4k

Rule-Based Classification in Data Mining
Mar 27, 2023 10.2k
Cyber Security

QA

Salesforce

Business Analyst

MS SQL Server

Data Science

DevOps

Hadoop

Python

Artificial Intelligence

Machine Learning

Tableau
Download Syllabus
Get Complete Course Syllabus
Enroll For Demo Class
It will take less than a minute
Tutorials
Interviews
You must be logged in to post a comment


