Month End Offer : Get 30% OFF + $999 Study Material FREE - SCHEDULE CALL
In today's world, data is the new oil. The amount of data generated daily is massive and continues to grow exponentially. To make sense of this vast amount of data, we need tools that can help us extract valuable insights from it. One such tool is cluster analysis.Cluster analysis is a technique used in data science to group similar objects or observations together based on their characteristics or attributes. It helps identify patterns and relationships within the data that might not be immediately apparent. Let's dive more into cluster analysis and learn more about its importance in data science or mining and key takeaways. You should check out the data science certification online to clarify your basic concepts.
Clustering involves grouping objects with similar traits into groups. Objects in one cluster are similar to those in others yet distinct. Grouped data may be compressed. Classification is a strong approach for distinguishing between classes of objects. Still, it requires collecting and labeling many training tuples or patterns for the classifier to represent each class. After clustering the data set, labeling the few remaining groups is often the best option. Flexible and able to discriminate between categories, this clustering-based approach helps.
Cluster analysis is used in market research, pattern identification, data analysis, and image processing. Clustering helps marketers segment clients by buying behavior. Biology uses it to create taxonomies, group genes that execute similar activities, and find hidden patterns in populations. Clustering may combine regions of similar land use in an earth observation database, categorize neighborhoods by house type, value, and location, and discover policyholder groups with high average claim costs in the automobile insurance sector. It can categorize Web material for searching.

Data cluster analysis might be simple or complex. Complex observations may have multiple continuous variables, binary variables, or a combination of both. Consider a two-dimensional group where graph proximity determines membership. Dimensions determined cluster complexity and cluster analysis.Various cluster analysis methods may show different clusters in the same dataset. Minimizing the Euclidean distance between a cluster center (generated by iterative analysis) and the points in the cluster produces a k-means cluster, the most common data cluster. Analysis type affects cluster appearance. Data clusters depend on iterations. Computers find the closest data points to cluster centers.
How often we run the computer's optimization algorithm affects this decrease. However, repeating results are rare. And if you are interested in a career path for data science, we have a complete guide to help you with your new career opportunities and growth.Since cluster analysis in a two-dimensional space looks natural, ignoring the statistical analysis is simple. However, this is an illusion. Visual clusters can "squeak by" in simple studies but not complex ones. Statistical approaches are needed to understand what is a data clusters in four-dimensional domains.
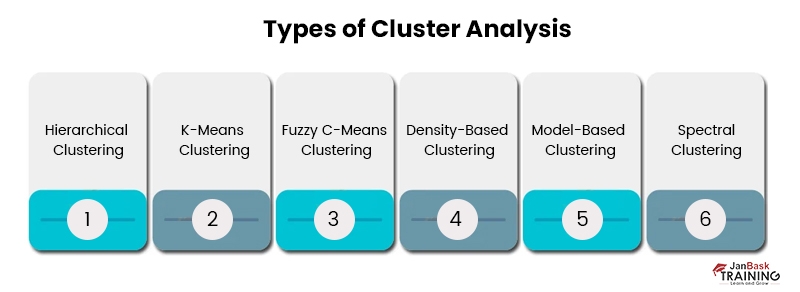
Let's explore the various clustering techniques used in data mining.
In this approach, assume that "m" partitioning is performed on "p" database items. In the case when m p, each partition will stand in for one cluster. After sorting things into categories, there are K of them. The Partitioning Clustering Method has a few prerequisites that must be met before it can be used successfully: -
Among the many various forms of clustering in data mining, In this hierarchical clustering approach, the provided set of an item of data is generated into a hierarchical decomposition. The structure of the resulting hierarchy ultimately determines the reasons for categorization. There are two sorts of approaches for the production of hierarchical decomposition, which are: –
Discordant Methodology
The Divisive Method is also known as the Top-Down Method. All data items are first stored in a single cluster. By repeatedly breaking the group, smaller clusters can be formed. Once the termination condition is reached, the process will stop, but the constant iteration technique will continue to iterate indefinitely. The decision cannot be undone when a group is divided or merged, making this approach rigid.
Agglomerative Approach
The bottom-up method is another term for this strategy. At the outset, everyone is split up into several groups. The process of consolidation continues until all groups have been consolidated or an end condition is reached. At each level of the hierarchical clustering process, one should thoroughly examine the object's connections.If you want to integrate hierarchical aggregation, you can utilize an algorithm designed specifically for the task. In this technique, first, the items are sorted into micro-clusters. Micro clustering is conducted. First, then macro clustering is performed on the microcluster.
Density-Based Clustering technique
The emphasis in this data mining clustering technique is on density. This clustering strategy relies on the concept of mass. With this kind of clustering, the group of nodes will expand indefinitely. Each data point should be inside the group's radius by at least some minimum threshold.
Clustering Using a Grid
The objects are clustered in a grid in this approach. To create a Grid Structure, we divide the object space into discrete cells based on some measurable parameter. Advantages of Grid-based clustering method: –
Clustering Techniques That Rely on Models
Each cluster is assumed to include the data that will work best for the model in this sort of clustering technique. In this strategy, the density function is clustered to pinpoint the community.
Clustering Approach Based on Constraints
When doing the clustering, we consider any applicable or user-specific limitations. The user's need is known as the limitation. As a result of these constraints, the process of grouping results in highly interactive communication.
There are several types of clusters in cluster analysis:
Overall, understanding the different types of clusters available in cluster analysis allows researchers and analysts to choose an appropriate method depending on their research question, dataset characteristics, and desired outcomes.
Cluster analysis is a powerful data mining technique that allows users to identify hidden patterns and relationships within large datasets. The process involves grouping similar objects or observations together based on their similarities or dissimilarities. This method has several advantages, including:
Cluster analysis is a popular technique used in data science to identify groups or clusters of similar objects within a dataset. Despite its many benefits, some disadvantages must be considered before using this method.
To mitigate these challenges during cluster analysis implementation, one should consider selecting appropriate distance metrics and clustering algorithms based on their specific use case needs while considering computational limitations. It's also important for analysts to have prior knowledge about their dataset to make informed decisions during the interpretation stage without relying solely upon automated methods like machine learning models, etcetera.
Application of Cluster Analysis
Cluster analysis can have various applications in data mining. Here’s a list of a few of the common applications of cluster analysis.
Customer Segmentation
Cluster analysis is widely used in customer segmentation to divide customers into distinct groups based on their behavior, preferences, and demographics. This helps businesses to tailor their marketing strategies according to the needs of different clusters of customers. For example, a retail company can use cluster analysis to identify high-value customers who make frequent purchases or loyal customers who have been with them for a long time.
Fraud Detection
Cluster analysis can be used in fraud detection by identifying patterns that are associated with fraudulent activities. An algorithm can detect unusual patterns that may indicate fraud by analyzing data from multiple sources, such as transaction history, user behavior, and account information.
Image Recognition
Cluster analysis has applications in image recognition, where it is used to categorize images into different groups based on similarities such as color scheme or texture. For example, an e-commerce website selling clothes can use image recognition through cluster analysis to combine similar products using visual features like color and style.
Anomaly Detection
Cluster analysis is also useful for detecting anomalies within datasets that fall outside normal patterns. Anomalies could include credit card transactions that occur at unusual times or locations compared to previous transactions made by the same user. Cluster algorithms can help identify these anomalies, which may indicate fraudulent activity.
Market Research
In market research, cluster analysis is commonly used for segmenting target markets based on consumer characteristics such as age range, income level, and interests/preferences. It allows companies to create targeted marketing campaigns specific to each market segment's unique needs and wants.Overall, cluster analysis has numerous applications across various industries, making it a valuable tool for businesses looking to improve decision-making processes through accurate data-driven insights.
Data Science Training For Administrators & Developers

We have seen what is a cluster analysis, how it works, the different types of clustering techniques available today, and some real-world applications across various domains.Cluster analysis provides valuable insights into complex datasets helping us understand underlying structures/patterns which might not be visible otherwise. It is a powerful tool in the data scientist's toolkit and can be applied to a wide range of problems with unstructured data. Understanding what is clustering analysis in data mining begins with understanding data science; you can get an insight into the same through our professional certification courses.

Basic Statistical Descriptions of Data in Data Mining
 May 11, 2023
  12.1k
12.1k
What is Model Evaluation and Selection in Data Mining?
Mar 28, 2023 12.1k

Rule-Based Classification in Data Mining
Mar 27, 2023 11.7k
Cyber Security

Data Science

QA

Salesforce Service Cloud

AWS
Download Syllabus
Get Complete Course Syllabus
Enroll For Demo Class
It will take less than a minute
Tutorials
Interviews
You must be logged in to post a comment


