Month End Offer : Get 30% OFF + $999 Study Material FREE - SCHEDULE CALL
Data science is all about extracting insights from data. However, not all datasets are created equal. One common issue that data scientists face is a class imbalance or unbalanced data. In this blog post, we will explore what imbalanced classes mean and how they can affect the accuracy of machine learning models. Understanding imbalance data classification in data mining begins with understanding data science; you can get an insight into the same through our Data Science Training.
A prevalence of data imbalance characterizes and underpins the world. The data distribution is usually skewed and has a tail-heavy distribution. Unhappily, the assumption of a normal distribution across all target categories is used to develop the great majority of today's machine learning algorithms (classification).
However, in many problems, such as those requiring continuous targets or even infinite values (regression), there are no distinct boundaries between the groups (i.e., age prediction, depth estimation, and so on).
In a dataset with two classes, balanced classes would mean an equal number of instances for each class. For example, if we have a dataset of credit card transactions where one class represents fraudulent transactions and the other non-fraudulent ones, then having an equal number of cases for both classes would be ideal.
However, in reality, many datasets have imbalanced classes where one class has significantly fewer instances than the other. For example, only 0.1% of credit card transactions may be fraudulent, while the rest are non-fraudulent.
Class imbalance can pose several challenges when building machine learning models because most algorithms assume an equal distribution between different classes in a dataset.
When dealing with imbalanced classification problems such as fraud detection or disease diagnosis where positive cases (fraudulent transactions or diseased patients) are rare compared to negative cases (non-fraudulent transactions or healthy patients), traditional algorithms tend to perform poorly on minority samples leading to low sensitivity rates which mean false negatives increase drastically affecting model performance negatively.
Moreover, since most models optimize for overall accuracy rather than per-class accuracy; thus optimizing for majority samples leads to poor performance on minority samples. You can check out the data science certification guide to understand more imabalnced data classification, and
Skills required to boost your career in data science.
Since the minority class is typically the more significant one in real-world applications, we often need to find ways to increase its identification rates when confronted with difficulties involving just unequal data representations. This issue complicates predictive modeling since learning algorithms will be skewed toward the majority class.
The extreme class imbalance with ratios ranging from 1:1000 to 1:5000 is a problem in many real-world applications, including the prevention of malicious attacks, the detection of life-threatening diseases, and the handling of rare cases in monitoring systems, highlighting the need for the design of intelligent systems that can adapt to and overcome such bias.
1. Data approach
2. Algorithm approach
3. Hybrid
It focuses on adjusting the training set such that a typical learning algorithm can work with it. To do this, the dataset's distributions, which fall into two broad classes, can be balanced:
If you take the number of correct predictions made by the classifier and divide it by the total number of predictions, you get the accuracy of the classifier. This could be satisfactory in a class with an even distribution of students. Still, it's far from ideal when one or more groups of students are significantly more significant than the others.
In contrast, precision evaluates the accuracy with which a classifier can predict a class, while recall evaluates the classifier's ability to identify a style correctly.
The F1 score is the better statistic to use when the classes in a dataset are unevenly distributed. The phrase represents the optimal balance between accuracy and memory.
a f1 rating
F1= 2*precision * recallprecision+recall
Therefore, the accuracy measure and the F1 score will both be low if the classifier predicts the minority class, but the prediction is incorrect, and the false-positive grows.
Additionally, recall and F1 scores will be unhappy if the classifier does a lousy job identifying the minority class, i.e., if a more significant percentage of this class is incorrectly projected as the majority class. Only as the number and quality of predictions increase will the F1 score rise.
Oversampling a dataset for a standard classification task can be accomplished in several ways.
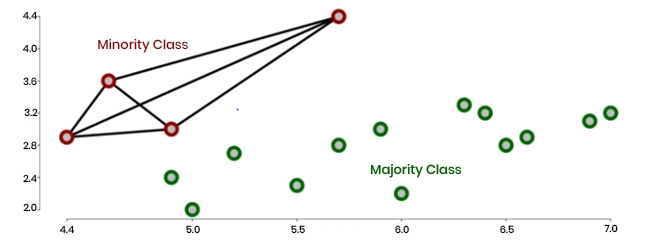
Synthetic Minority Oversampling Method (or SMOTE for short) is the most often used data augmentation method.
To avoid the problems associated with oversampling, SMOTE generates synthetic instances. Here's how SMOTE operates in detail: In the first step, an example from a minority group is chosen randomly, and its k closest neighbors from the same group are determined using the same method. Then, a synthetic example is generated at some random position along the line joining the two instances in feature space.Using this method, we create a synthesis of new minority-group cases.
When introduced to the training set, SMOTE's synthetic examples for the minority class serve to equalize the distributions of the types, leading the classifier to generate more generic and less particular decision regions that aid in generalization and prevent overfitting.
Data augmentation techniques used successfully in handwritten character recognition inspire this method since they allow for natural ways to disturb the training data through operations such as rotation and skew.
Advantages
As synthetic instances are created instead of carbon copies of existing examples, overfitting due to random oversampling is reduced.
There was no data loss.
Just do it.
Disadvantages
SMOTE does not consider nearby instances, which may be from various classes while producing synthetic examples. This may cause more classes to blend and contribute more background noise to the system.
High-dimensional data makes SMOTE impractical.

Here, we take a similar number of samples from the minority group as we do from the majority group.
Two approaches exist for accomplishing this:
Selecting a small number of samples at random from the largest group is the quickest and most convenient technique to achieve data balance.
Adding some common sense guidelines to the selected models, NearMiss uses three algorithms, although we'll look at one of them now.
Cases from the NearMiss-2 majority group are within an average of the three most distant minority examples.
A few items stand out from the confusion matrix:
As opposed to oversampling, undersampling needs to determine better which group constitutes the vast majority (True Positive). Other than that, it is preferable to oversampling since it more accurately identifies the minority class while producing fewer False Negatives.
Advantages
Data scientists might achieve balance in the dataset to avoid their analysis or machine learning algorithm leaning too far towards the majority. Scientists may encounter the accuracy paradox if they run a classification model with 90% accuracy without resampling. But if they look more closely, they'll see that the results fall broadly inside the dominant group.
Having fewer data to store and longer analysis times are both benefits. The less information there is to store and analyze, the less time and effort will be required.
Disadvantages
Data loss occurs when enough instances from the majority group are removed to make that group the same size as the minority group.
The analysis's conclusion may need to be revised since the sample of the majority class was selected at random rather than being representative of the population at large. That can lead to problems when the classifier is applied to actual, unseen data.
Synthetic Minority Over-sampling Technique (SMOTE) is an oversampling method designed specifically for handling imbalanced datasets by generating synthetic samples from the minority class using interpolation techniques.
The idea behind SMOTE is simple - create new synthetic samples by interpolating between existing minority-class samples while preserving their underlying characteristics. By doing so, we increase the representation of the minority class without introducing bias into our model training process.
The Balanced Bagging Classifier is a machine learning algorithm that has been developed to deal with imbalanced datasets. In an imbalanced dataset, the number of instances belonging to one class is significantly larger than those belonging to another class. This can lead to biased results and poor performance of traditional classification algorithms. The Balanced Bagging Classifier addresses this issue by using a combination of bagging and resampling techniques to balance the classes in the training set, ensuring that each class has an equal representation. A study conducted on 15 different datasets showed that the Balanced Bagging Classifier outperformed other state-of-the-art classifiers such as Decision Trees, Random Forests, and Support Vector Machines when dealing with imbalanced data. Furthermore, it was found that increasing the degree of imbalance led to even greater improvements in accuracy for the Balanced Bagging Classifier compared to other methods. Therefore, incorporating balanced bagging into machine learning models can greatly improve their ability to handle real-world problems where there are significant differences in class sizes within datasets.
Threshold moving class imbalanced problems refer to the challenges that arise when dealing with datasets where one class is significantly underrepresented compared to the other(s). This can lead to biased models and inaccurate predictions, as the algorithm may prioritize accuracy on the majority class at the expense of correctly identifying instances of the minority class. One approach to address this issue is threshold-moving, which involves adjusting classification thresholds based on a desired balance between precision and recall for both classes. Research has shown that using threshold-moving methods can improve model performance in imbalanced datasets, particularly in medical diagnosis or fraud detection applications where correct identification of rare events is crucial. For example, a study by Chen et al. (2018) found that threshold-moving techniques improved prediction accuracy for detecting heart disease in an imbalanced dataset compared to traditional approaches. Therefore, incorporating threshold-moving methods into machine learning algorithms can help mitigate issues related to class imbalance and improve overall model performance.
This method focuses on adjusting already established models to lessen their favoritism towards the majority. This approach calls for a deep understanding of the adapted learning algorithm and the pinpoint isolation of the specific causes of its inability to learn the representations of skewed distributions.
Budget-friendly methods dominate the field (weighted learners). Here, we modify the existing model to include different punishments for each set of cases. With Focal loss, we provide greater weight to the under-represented class in our cost function and punish the model for misclassifying members of that group while giving less weight to members of the over-represented group. So, it becomes more vital to the educational process.
Applying one-class learning, also known as one-class classification(OCC), isolates the subset of interest in the data, another promising algorithm-level option. By narrowing our focus to a single class of things, we can eradicate prejudice towards anybody or anything.
OCC's outlier and anomaly detection methods can be helpful in cases of asymmetric categorization. This method is accomplished by training the model on data from the majority class (also called positive examples) and using that information to make predictions about whether or not newly acquired data belong to the majority class or to the minority class (i.e., whether or not it is an outlier/anomaly).
Common examples of OCC difficulties are
Still, minority class is difficult, costly, or impossible to obtain.
Class imbalance is a common problem in machine learning, where the number of instances belonging to one class significantly outweighs that of another. This can lead to biased models with poor performance on underrepresented classes. One approach to address this issue is the Hybrid Approach, which combines oversampling and undersampling techniques for optimal results. By using both methods together, it's possible to reduce bias towards majority classes while still maintaining enough data from minority classes for accurate predictions. In this blog post, we'll dive into the details of Hybrid Approach and how it can be used effectively to tackle class imbalanced data problems.
Due to the excessively uneven distribution of classes, the challenge of unbalanced categorization as a predictive modeling issue is significantly more complex. Consequently, traditional machine learning models and evaluation criteria, which presuppose a normal distribution of classes, could have a better level of performance. Although it is true that modeling imbalanced datasets, in general, is complex, additional aspects of a classification dataset make it much more challenging.
You have an unbalanced classification if the number of classes in your dataset is not distributed uniformly.
An illustration of this would be an issue of classifying items into two categories, where the vast majority of items are assigned to Category 0, and just a few are assigned to Category 1. There is a wide range of possible severity distributions, ranging from one to two, one to ten, and one hundred to one thousand.
Because of the uneven structure of the classes, most machine learning algorithms will need help producing correct predictions. These machine learning algorithms must be modified to prevent them from always making predictions for the course with the most significant number of members. When evaluating predictions based on skewed data, classification measures become useless, and additional methodologies, such as ROC area under the curve, are required.
This is the most fundamental problem with a categorization system that is unequal.
The issuing domain utilized to produce examples contributed further to the situation's complexity by introducing mismatched class structures.
The majority class in the domain commonly represents standard cases, while the minority class often represents faults, frauds, outliers, oddities, disease states, etc. The majority class may also represent typical cases in the domain. As a consequence of this, different groups' perceptions of misclassification errors will differ.
A false-positive, which occurs when an example from the majority class is incorrectly labeled as an example from the minority class, is undesirable. Still, it is not nearly as serious as a false negative, which occurs when an example from the minority class is incorrectly labeled as belonging to the majority class.
The sensitivity of costs to misclassification errors is a second fundamental challenge arising from imbalanced categorization.
It is usual to practice bringing up the asymmetry of class distribution and the sensitivity of costs while discussing the difficulties presented by imbalanced categorization.
On the other hand, when combined with many other components of the classification problem, these characteristics have an even more substantial influence. A previously complicated procedure is made even more difficult by all of these factors, which are universal to classification predictive modeling.

Data Science Training
Class imbalance is a common issue in data science that can affect model performance negatively. However, there exist various techniques to handle it effectively. As a data scientist, choosing appropriate evaluation metrics and selecting an optimal solution based on available resources are essential steps toward building effective machine learning models for real-world scenarios where imbalanced classification problems arise frequently. You can learn the six stages of data science processing to better grasp the above topic.

Basic Statistical Descriptions of Data in Data Mining
 May 11, 2023
  12.1k
12.1k
What is Model Evaluation and Selection in Data Mining?
Mar 28, 2023 12.1k

Rule-Based Classification in Data Mining
Mar 27, 2023 11.7k
Gen AI

Agentic AI

AI in Automation Testing

Cyber Security

Data Science

QA

Salesforce Service Cloud

AWS
Download Syllabus
Get Complete Course Syllabus
Enroll For Demo Class
It will take less than a minute
Tutorials
Interviews
You must be logged in to post a comment


