Grab Deal : Upto 30% off on live classes + 2 free self-paced courses - SCHEDULE CALL
Clustering is a popular unsupervised machine-learning technique that involves grouping similar data points. It is widely used in various fields, including image recognition, customer segmentation, and anomaly detection. However, before applying any clustering algorithm to a dataset, it's essential to assess the clustering tendency of the data. If you are interested in pursuing a data science certification course, you must possess a few technical and non-technical skills to survive in the field. In this blog post, we'll discuss assessing clustering tendency and how it is used.
Clustering tendency refers to a dataset's inherent structure or pattern that makes it suitable for clustering analysis. Clustering algorithms won't effectively find meaningful groups if the data has no underlying structure or pattern. Therefore, assessing clustering tendency helps determine whether a given dataset can be clustered effectively or not.Clustering tendency can be assessed through various methods such as visual inspection, statistical tests, and model-based approaches. Visual inspection involves plotting the data in a scatter plot or other graphical representation to see if any distinct groups or clusters emerge. This method is helpful for small datasets but may not be practical for larger ones.
Statistical tests measure a dataset's degree of clustering tendency. The Hopkins statistic calculates the probability that a dataset is generated from a uniform distribution. The Silhouette coefficient measures how well each data point fits into its assigned cluster. These tests can guide the choice of the clustering algorithm.Model-based approaches involve fitting various models to the data and comparing their goodness-of-fit statistics to determine whether a particular model adequately represents the underlying structure in the data. Model-based methods are more complex than a visual inspection or statistical tests but can provide more detailed information about clustering tendencies.It's important to note that even if there is a clustering tendency present in a dataset, it doesn't necessarily mean that all clustering algorithms will work equally well on it. Different algorithms have varying assumptions about cluster shape, size, density, etc., which may affect their performance on specific datasets.
The method or index for assessing clustering tendency is a crucial tool in the field of data analysis and machine learning. This index provides a quantitative measure to determine whether there is any inherent structure or natural grouping within a dataset before applying clustering algorithms. By using this index, researchers can avoid wasting computational resources on datasets that do not possess meaningful clusters.
One popular method used to assess clustering tendency is the Hopkins statistic, which measures the probability that a given dataset is generated by a uniform distribution rather than being clustered. Research conducted by Banerjee et al. (2004) demonstrated the effectiveness of this approach in various applications, such as image segmentation and document classification.To calculate the Hopkins statistic, random points are first generated within the same range as the original dataset. The distances between these randomly placed points and their nearest neighbors from both datasets (original and randomized) are then computed. A low value of Hopkins statistic indicates that it is unlikely for randomly placed points to be closer to each other compared to actual data points, suggesting strong evidence of clustering tendencies.
For instance, consider an example where we have customer purchasing behavior data from an online retail store. We can use the index for assessing clustering tendency to determine if there are distinct groups among customers based on their buying patterns. If significant clusters exist, marketing strategies could be tailored towards each group's preferences and needs.incorporating an index for assessing clustering tendency into our analysis process allows us to make informed decisions about when and how to apply clustering algorithms effectively. It saves valuable time and computational resources while ensuring meaningful results in various domains ranging from healthcare analytics to market segmentation studies.
There are several methods for assessing clustering tendency; let's discuss some of them below:
Hopkins Statistic:
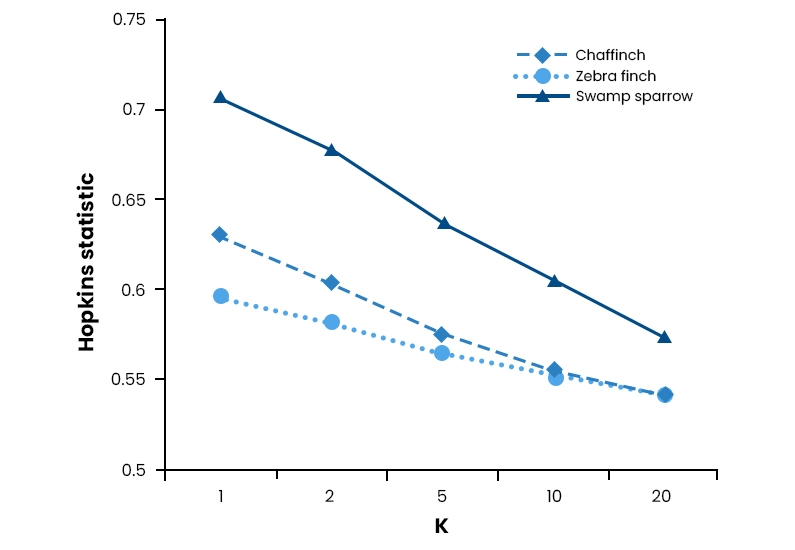
The Hopkins statistic measures how well a dataset can be clustered by comparing distances between randomly selected points with distances between each point and its nearest neighbor. A value close to 1 indicates high clusterability, while values closer to 0 indicate low clusterability.The Hopkins statistic is a valuable tool in data analysis and machine learning. It helps to determine whether a dataset can be easily clustered or not. Clustering refers to grouping similar data points based on their features or attributes.
To calculate the Hopkins statistic, random points are selected from the dataset, and their distances are compared with the distances between each point and its nearest neighbor. If the distance between two randomly selected points is more minor than between a point and its nearest neighbor, it suggests that clusters may be present in the data.A value close to 1 indicates that clustering is highly possible, while values closer to 0 indicate low clusterability. If you have a high Hopkins statistic for your dataset, grouping similar observations into meaningful clusters may be more accessible.
For example, you have a customer database containing information about purchase history, demographics, and behavior patterns. You want to use this information to segment customers into different groups based on their similarities. Calculating the Hopkins statistic for this dataset before applying clustering algorithms like k-means or hierarchical clustering techniques can help identify how well-suited your data is for such tasks.
Silhouette Score:
The silhouette score is a widely used metric in clustering analysis, which evaluates the quality of cluster formation. The score measures how well each data point fits into its assigned cluster compared to other clusters' fitment levels. It uses both intra-cluster similarity and inter-cluster dissimilarity to determine the optimal number of clusters.
For instance, if a data point has a high silhouette score (close to +1), it is well-matched with its cluster and poorly matched with other clusters. On the other hand, if it has a low score (close to -1), it indicates that the data point may be better suited for another cluster than its current one.
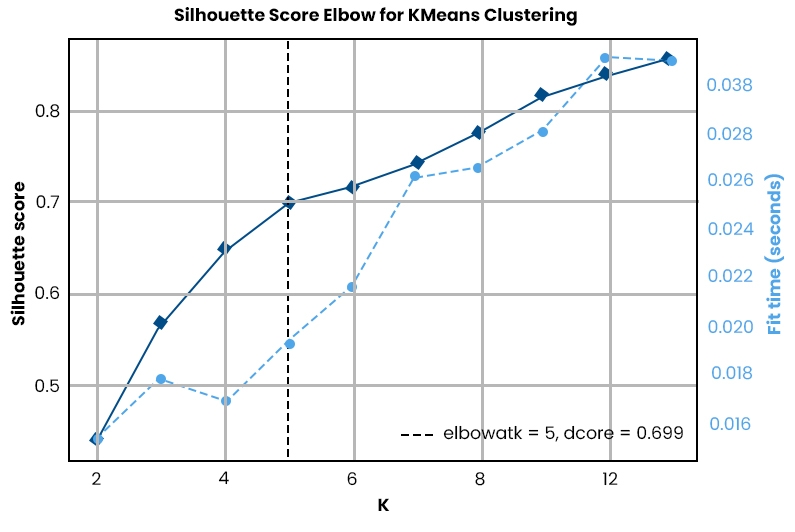
One advantage of using the silhouette score is that it does not require prior knowledge about the number of clusters in the dataset. Therefore, analysts can use this metric as an initial step to identify potential numbers of clusters before proceeding with more complex algorithms such as K-means or hierarchical clustering.
Gap Statistic:
The gap statistic method objectively determined an optimal number of clusters based on within-cluster dispersion and expected dispersion under null reference distribution generated using Monte Carlo simulations. In simpler terms, this method compares how much variation exists within a given set of data points against what would be expected if those same points were randomly distributed across multiple groups.
In practice, gap statistics generate several randomized datasets similar in size and structure to the original dataset being analyzed. Each randomized dataset will have different numbers of groups ranging from 1 through some specified maximum value.After generating these datasets, we compute their respective gaps between observed values and simulated values for different numbers of groups tested. Finally, we select the optimal number to observe the maximum gap value among all tested groupings.This approach helps us avoid overfitting our model by calculating only meaningful differences between actual observations versus random ones while ensuring robustness during calculations after accounting for noise sources like outliers or missing values.a gap statistic method is a helpful tool for clustering analysis that helps to determine an optimal number of clusters by comparing within-cluster dispersion with expected dispersion under null reference distribution generated using Monte Carlo simulations.The elbow method is a popular technique used in data clustering to determine the optimal number of clusters required for grouping similar data points. The objective of clustering is to group similar observations or data points based on certain features or attributes, and this can be achieved by partitioning the dataset into distinct groups or clusters.
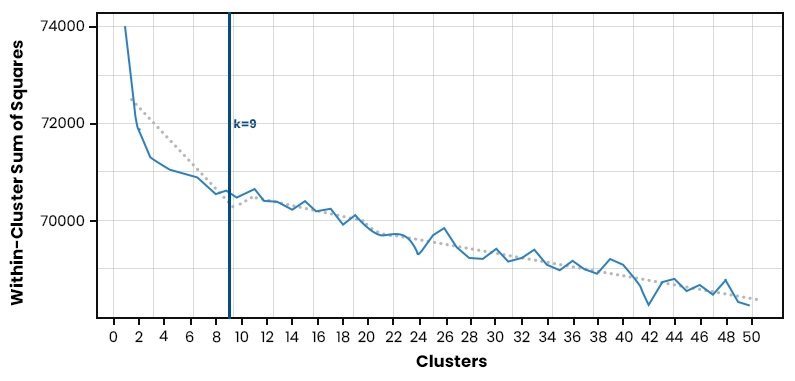
In the elbow method, the percentage variance (PVE) is calculated for different numbers of clusters. The PVE represents how much variation in the original dataset can be explained by each cluster. As more clusters are added, a significant increase in PVE as more structure is identified within the data. However, adding additional clusters will not improve the explanatory power and will lead to overfitting.To apply the elbow method, we plot a graph with the number of clusters on the X-axis vs. the Percentage Variance Explained on the Y-axis. We look for an "elbow" point where additional clustering does not significantly improve performance but before which large amounts of variance have been captured.
For example, we want to cluster customer transactions based on their purchase behavior using three variables: amount spent per transaction, frequency of monthly purchases, and time since the last purchase. To determine how many distinct segments exist among our customers' purchasing behaviors, we might use the K-means Clustering algorithm with different values for k (number of expected segments). Using the Elbow Method, we could identify that 3 was an appropriate value because it provided a good balance between accuracy and complexity. Beyond this point, segment quality was slightly improved despite increasing computational expense from different iterations.
Understanding when diminishing returns begin helps us avoid overfitting models while aiming to capture underlying patterns within our datasets so they generalize well beyond training samples! Data Science is a growing popular field in this hi-tech era. Hence, you must possess the necessary skills and insight to become a data scientist. Becoming a successful data analyst constitutes receiving a proper degree, having knowledge of programming languages, gaining experiences from internships, and getting certified for a prominent job role.
Data Science Training For Administrators & Developers

Assessing clustering tendency is crucial in applying clustering algorithms to any dataset. It helps determine whether the data has an inherent structure or pattern that makes it suitable for clustering analysis. This blog post discussed popular methods for assessing clustering tendency, including the Hopkins statistic, silhouette score, gap statistic, and elbow method. Machine learning practitioners can use these techniques to decide which clustering algorithm and parameters best suit their use case. The reason boils down to the fact that they don’t need to waste financial resources on training new workers, and your certificate shows that you have a deep knowledge of the topic. It serves as an evidence of your skills and insight. Understanding assessing clustering tendency in data mining begins with understanding data science; you can get an insight into the same through our data science training.
FAQ’s
Q.1. What are The Benefits of Oting for a Data Science Course?
Ans: There are several benefits of going for a Data Science course. The advantages include a sure escalation in the career graph, flexibility to select from a wide range of options as to which field to pursue related to data science, a well-maintained education program, and knowledge in-depth about data science tools. The Data science training also allows you to learn how to implement theories to business issues and keeps you informed about ongoing trends.
Q.2. What are The Various Career Options That you can Pursue After Taking The Data Scientist Course?
Ans: The data scientist certification course opens the gate to various career opportunities, such as Business Intelligence Analyst, Data Mining Engineer, Data Architect, Data Scientist, and Senior Data Scientist.
Q.3. What are The Prime Objectives of The Data Science Course?
Ans: The objective of the Data science course includes offering extensive Data science training to impart the basic and advanced knowledge of Data Science so that you can clear the certification exam in one go. The data scientist certification course prepares you through its interesting e-learning tools so that you can crack the exam easily.
Q.4. How is Assessing Clustering Tendency Beneficial for Someone?
Ans: The advantages of assessing clustering tendency are as follows:
Q.5. What do you mean by Assessing Clustering Tendency Visually?
Ans: Visual assessment of clustering tendency is the method where the algorithm denotes the count of clusters that resides in a dataset, and it also represents if clusters are present within clusters. This is done by making densely black squares in the left diagonal of a square-size Map.

Basic Statistical Descriptions of Data in Data Mining
 May 11, 2023
  10.9k
10.9k Mar 03, 2023 10.5k

Rule-Based Classification in Data Mining
Mar 27, 2023 10.3k
Cyber Security

QA

Salesforce

Business Analyst

MS SQL Server

Data Science

DevOps

Hadoop

Python

Artificial Intelligence

Machine Learning

Tableau
Download Syllabus
Get Complete Course Syllabus
Enroll For Demo Class
It will take less than a minute
Tutorials
Interviews
You must be logged in to post a comment


