Introduction
To access the data in Salesforce, we need Reports. It is possible examining Salesforce data into infinite combinations; display it in easy to understand formats, share meaningful insights with other users. Before we go a little deep and discuss the different report formats in detail, let us first review the report basics quickly.
When you are preparing a report for your Salesforce data, keep these facts in mind:
- When reports are designed well, they run faster.
- Before you start building a report, write down multiple questions that must be answered. In this way, the report is sure to return all the maximum data you need.
- Reports are generally shared by folders. The users that are permitted to access the folder can view the report as well. Make sure that reports are always saved in an appropriate manner.
Before you build your first report, familiarize yourself with basic concepts first as given below.
- Report Builder: This is a visual drag-drop tool that can be used to create or edit reports. This is the platform where you will choose a report type, report format, and fields to make up the full report. To launch the report builder, just click on the New Report.
- Fields: With fields, this is easy to describe the report result. Just imagine that you had one report with a table of content then each row is a result and each column is a field. Take the example of an employee table where each employee is the result and information stored is fields. Every time you edit or create a report then you should include fields in the report. To run a report quickly, this is a wise idea including necessary fields only.
- Filters: You should limit the data access into reports using filters. Filters can be used for multiple reasons and they make sure that data returns are quick. This is easy to add, edit, or removing filters when reading a report.
- Report Types: The report type governs the total number of fields available in your report. For example, File or content reports have fields like ID, Name, or Total downloads etc. On the other hand, account reports have account ID, Account name or Phone etc. The first thing to complete when creating a report is to decide on its type.
- Report Format: The report format will decide how the results of a report are laid out. There are four possible report formats in Salesforce – Tabular, Summary, matrix, and Joined etc. Joined reports are not available in Lightning Experience. So, you can use only three in that case.
Salesforce Training For Administrators & Developers
- No cost for a Demo Class
- Industry Expert as your Trainer
- Available as per your schedule
- Customer Support Available
The objective of this blog is to discuss each file format in detail and how to create reports in different file formats. Always choose the format that is complex enough to capture the business data and simple enough to communicate effectively.
Read: Salesforce Admin Resume Examples: Land Your Dream Job

How To Create A Tabular Report In Salesforce?
Tabular reports are the fastest and simplest technique to look at data. When compared to spreadsheets, they are quite similar and consist of an ordered set of fields and columns with matching record listed in the row. Tabular reports are good for creating a complete list of records or a single grand total. It cannot be used to create a group of charts and cannot be accessed in the dashboard unless the number of rows is limited. Examples of tabular report format include mailing lists and activity reports. Let us learn how to create a Tabular report in the Salesforce.
- Go to Reports option, click on New Report, choose the opportunities Report Type, and Click on Create.
- Add filters like select all opportunities to show, select open for opportunity status, select create date for Date Field, and select current FY for Range. For the quick results, choose the smallest data range. If your report has to switch among multiple dates then it may take a longer time to show the information you asked for.
- A list of columns that are usually involved with a report are Opportunity Name, Lead Source, type, amount, expected revenue, close date, next step, stage, probability, Owner, Account name, Age, Date created, Fiscal period etc.
- Accept the auto-generated unique names and Click on Save option.
- Now enter a description and Choose My personal custom reports folder.
- Click on the Run report button once all changes are made successfully.
Based on the org type, you may or may not see data in the report during runtime.
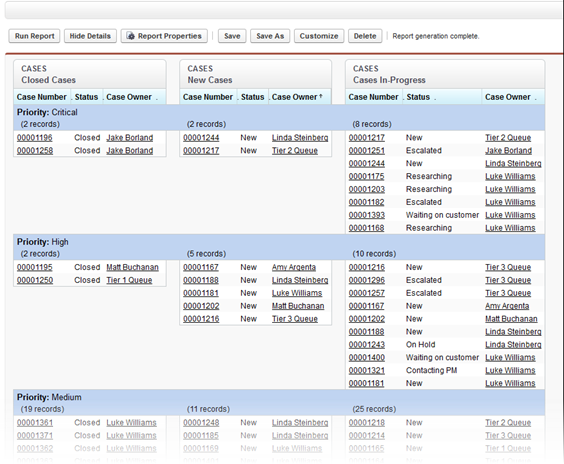
How to Create a Summary Report in Salesforce?
The summary report is very much similar to the Tabular report but allowing users to group rows of data, create charts, and view subtotals etc.
Read: Salesforce Sales Cloud Certification Guide: Exam Details & Passing Tips
Summary reports generally take more time to set up but they give more options to organize data and great to use with dashboards. We can say that summary reports are the workhorses and most of the reports are available in this particular format only. So, let us start our discussion on how to create a summary report in the Salesforce.
- Go to Reports option, click on New Report, choose Cases Report Type, and Click on Create.
- Add filters like select all cases to show, select data opened for the date field, Select the previous fiscal year FY for the range.
- If you wanted to put more filters for cases then click on Add button where status is closed. Select closed, leave the operator set equals, and click on lookup icon, select True in the end.
- The following columns should already be included for the summary report like Case Owner, Data/time opened, Subject, Open, Closed, Age, or Account Name etc.
- Select Tabular option first then select the Summary option from the drop-down list as shown below
- Drag the necessary fields as per their priority from the field pane and add them to the Preview pane. You can also add multiple fields together to a group.
- Accept the auto-generated unique names and Click on Save option.
- Now enter a description and Choose My personal custom reports folder.
- Click on the Run report button once all changes are made successfully.
- Based on the org type, you may or may not see data in the report during runtime.
- Use the hide fields button to easily collapse records at a glance by summarized fields. Click on Show fields button to unhide the fields again.
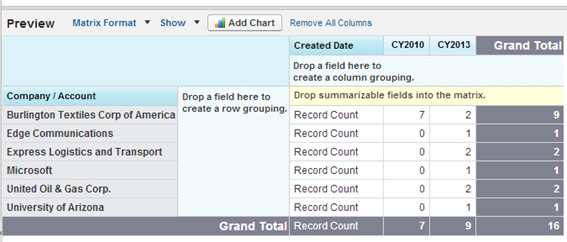
How to Create Matrix Report in Salesforce?
Matrix reports allow you to group records together by rows and columns. This is not easy setting up a matrix report but they do always provide a detailed view of the data. Like summary reports, Matrix reports also have graphs and they can be used in dashboards as well. So, what is unique about the matrix report? If you are looking for at a glance overview of data, something like revenues or quantity of products sold then matrix report is the best option to use here. When we compare at a glance view of two report formats like Summary and Matrix then the second one is always easy to read and understand. Now, you must be sure why matrix reports are necessary for an organization. Let us see together how to build a matrix report ahead.
- Go to Reports option, click on New Report, choose the opportunities Report Type, and Click on Create.
- Add filters like select all opportunities to show, select Closed Won for the opportunity status, select a close date for Date Field, and select current FY for Range. Always choose the range that fits best for the data you want to analyze.
- Make sure that range is smallest to produce faster results. If your report has to switch among multiple dates then it may take a longer time to show the information you asked for.
- Select Tabular option first then select the Matrix option from the drop-down list as shown below.
- This is possible grouping the reports by type and drag the fields into column grouping one by one.
- There are multiple techniques to group a report and you can choose the best one as needed.
- Click on Menu for the Amount option and select the summarized field.
- Click on deselect or show the record count.
- Click on Save option and matrix report is created successfully.
- You may want to hide certain details when creating a Matrix report. They are usually easy to consume with hidden details.
- Accept the auto-generated unique names and Click on Save option.
- Now enter a description and Choose My personal custom reports folder.
- Click on the Run report button once all changes are made successfully.
Salesforce Training For Administrators & Developers
- Personalized Free Consultation
- Access to Our Learning Management System
- Access to Our Course Curriculum
- Be a Part of Our Free Demo Class
Read: Easy Tips to Clear Salesforce Admin Exam in Just One Attempt
How To Create Joined Reports In Salesforce?
Joined reports are not available in the Salesforce Lightning Experience. To use joined reports, you should use Salesforce Classic. Joined reports let you create multiple points of data from different report types.
Here, data is organized into blocks and each block will act like a sub-report with its own fields, sorting, columns, and filtering techniques. This is possible adding charts to a joined report. Here are the steps to follow when creating a Joined Report.
- Go to Reports option, click on New Report, choose the opportunities Report Type, and Click on Create.
- From the Tabular format, click on Joined. Now you can notice that report data is now set off with a colored border. This is your first block.
- Create a new block by dragging the opportunity name from the preview pane and drag the amount or account name too.
- In the same way, create multiple blocks and make sure that each block should give comparable information as required.
- Now configure the blocks properly and group them together as needed.
- Click on Save option and Run the report.
In this way, you can create reports in different formats based on project requirements. Creating and maintaining a report is always easy with the right approach and process. In case of any doubt, you should join our Salesforce certification training course for practical learning.
Read: How to Build Lightning Map in Salesforce?
Introduction
To access the data in Salesforce, we need Reports. It is possible examining Salesforce data into infinite combinations; display it in easy to understand formats, share meaningful insights with other users. Before we go a little deep and discuss the different report formats in detail, let us first review the report basics quickly.
When you are preparing a report for your Salesforce data, keep these facts in mind:
- When reports are designed well, they run faster.
- Before you start building a report, write down multiple questions that must be answered. In this way, the report is sure to return all the maximum data you need.
- Reports are generally shared by folders. The users that are permitted to access the folder can view the report as well. Make sure that reports are always saved in an appropriate manner.
Before you build your first report, familiarize yourself with basic concepts first as given below.
- Report Builder: This is a visual drag-drop tool that can be used to create or edit reports. This is the platform where you will choose a report type, report format, and fields to make up the full report. To launch the report builder, just click on the New Report.
- Fields: With fields, this is easy to describe the report result. Just imagine that you had one report with a table of content then each row is a result and each column is a field. Take the example of an employee table where each employee is the result and information stored is fields. Every time you edit or create a report then you should include fields in the report. To run a report quickly, this is a wise idea including necessary fields only.
- Filters: You should limit the data access into reports using filters. Filters can be used for multiple reasons and they make sure that data returns are quick. This is easy to add, edit, or removing filters when reading a report.
- Report Types: The report type governs the total number of fields available in your report. For example, File or content reports have fields like ID, Name, or Total downloads etc. On the other hand, account reports have account ID, Account name or Phone etc. The first thing to complete when creating a report is to decide on its type.
- Report Format: The report format will decide how the results of a report are laid out. There are four possible report formats in Salesforce – Tabular, Summary, matrix, and Joined etc. Joined reports are not available in Lightning Experience. So, you can use only three in that case.
Salesforce Training For Administrators & Developers
- No cost for a Demo Class
- Industry Expert as your Trainer
- Available as per your schedule
- Customer Support Available
The objective of this blog is to discuss each file format in detail and how to create reports in different file formats. Always choose the format that is complex enough to capture the business data and simple enough to communicate effectively.
Read: Salesforce Sales Cloud Certification Guide: Exam Details & Passing Tips
How To Create A Tabular Report In Salesforce?
Tabular reports are the fastest and simplest technique to look at data. When compared to spreadsheets, they are quite similar and consist of an ordered set of fields and columns with matching record listed in the row.Tabular reports are good for creating a complete list of records or a single grand total. It cannot be used to create a group of charts and cannot be accessed in the dashboard unless the number of rows is limited. Examples of tabular report format include mailing lists and activity reports. Let us learn how to create a Tabular report in the Salesforce.
- Go to Reports option, click on New Report, choose the opportunities Report Type, and Click on Create.
- Add filters like select all opportunities to show, select open for opportunity status, select create date for Date Field, and select current FY for Range. For the quick results, choose the smallest data range. If your report has to switch among multiple dates then it may take a longer time to show the information you asked for.
- A list of columns that are usually involved with a report are Opportunity Name, Lead Source, type, amount, expected revenue, close date, next step, stage, probability, Owner, Account name, Age, Date created, Fiscal period etc.
- Accept the auto-generated unique names and Click on Save option.
- Now enter a description and Choose My personal custom reports folder.
- Click on the Run report button once all changes are made successfully.
Based on the org type, you may or may not see data in the report during runtime.
How to Create a Summary Report in Salesforce?
The summary report is very much similar to the Tabular report but allowing users to group rows of data, create charts, and view subtotals etc.
Read: What is the Custom Setting in Salesforce? Know in 2020
Summary reports generally take more time to set up but they give more options to organize data and great to use with dashboards. We can say that summary reports are the workhorses and most of the reports are available in this particular format only. So, let us start our discussion on how to create a summary report in the Salesforce.
- Go to Reports option, click on New Report, choose Cases Report Type, and Click on Create.
- Add filters like select all cases to show, select data opened for the date field, Select the previous fiscal year FY for the range.
- If you wanted to put more filters for cases then click on Add button where status is closed. Select closed, leave the operator set equals, and click on lookup icon, select True in the end.
- The following columns should already be included for the summary report like Case Owner, Data/time opened, Subject, Open, Closed, Age, or Account Name etc.
- Select Tabular option first then select the Summary option from the drop-down list as shown below
- Drag the necessary fields as per their priority from the field pane and add them to the Preview pane. You can also add multiple fields together to a group.
- Accept the auto-generated unique names and Click on Save option.
- Now enter a description and Choose My personal custom reports folder.
- Click on the Run report button once all changes are made successfully.
- Based on the org type, you may or may not see data in the report during runtime.
- Use the hide fields button to easily collapse records at a glance by summarized fields. Click on Show fields button to unhide the fields again.
How to Create Matrix Report in Salesforce?
Matrix reports allow you to group records together by rows and columns. This is not easy setting up a matrix report but they do always provide a detailed view of the data. Like summary reports, Matrix reports also have graphs and they can be used in dashboards as well. So, what is unique about the matrix report? If you are looking for at a glance overview of data, something like revenues or quantity of products sold then matrix report is the best option to use here.When we compare at a glance view of two report formats like Summary and Matrix then the second one is always easy to read and understand. Now, you must be sure why matrix reports are necessary for an organization. Let us see together how to build a matrix report ahead.
- Go to Reports option, click on New Report, choose the opportunities Report Type, and Click on Create.
- Add filters like select all opportunities to show, select Closed Won for the opportunity status, select a close date for Date Field, and select current FY for Range. Always choose the range that fits best for the data you want to analyze.
- Make sure that range is smallest to produce faster results. If your report has to switch among multiple dates then it may take a longer time to show the information you asked for.
- Select Tabular option first then select the Matrix option from the drop-down list as shown below.
- This is possible grouping the reports by type and drag the fields into column grouping one by one.
- There are multiple techniques to group a report and you can choose the best one as needed.
- Click on Menu for the Amount option and select the summarized field.
- Click on deselect or show the record count.
- Click on Save option and matrix report is created successfully.
- You may want to hide certain details when creating a Matrix report. They are usually easy to consume with hidden details.
- Accept the auto-generated unique names and Click on Save option.
- Now enter a description and Choose My personal custom reports folder.
- Click on the Run report button once all changes are made successfully.
Salesforce Training For Administrators & Developers
- No cost for a Demo Class
- Industry Expert as your Trainer
- Available as per your schedule
- Customer Support Available
Read: App Builder Salesforce Certification - Complete Exam Details & Passing Tips
How To Create Joined Reports In Salesforce?
Joined reports are not available in the Salesforce Lightning Experience. To use joined reports, you should use Salesforce Classic. Joined reports let you create multiple points of data from different report types.
Here, data is organized into blocks and each block will act like a sub-report with its own fields, sorting, columns, and filtering techniques. This is possible adding charts to a joined report. Here are the steps to follow when creating a Joined Report.
- Go to Reports option, click on New Report, choose the opportunities Report Type, and Click on Create.
- From the Tabular format, click on Joined. Now you can notice that report data is now set off with a colored border. This is your first block.
- Create a new block by dragging the opportunity name from the preview pane and drag the amount or account name too.
- In the same way, create multiple blocks and make sure that each block should give comparable information as required.
- Now configure the blocks properly and group them together as needed.
- Click on Save option and Run the report.
In this way, you can create reports in different formats based on project requirements. Creating and maintaining a report is always easy with the right approach and process. In case of any doubt, you should join our Salesforce certification training course for practical learning.
Read: How Much Does Salesforce Certification Cost?
Introduction
Salesforce Vs. Different Technologies
Interview
Salesforce Course
Upcoming Batches
Trending Courses
Cyber Security
- Introduction to cybersecurity
- Cryptography and Secure Communication
- Cloud Computing Architectural Framework
- Security Architectures and Models
Upcoming Class
1 day 19 Sep 2025
QA
- Introduction and Software Testing
- Software Test Life Cycle
- Automation Testing and API Testing
- Selenium framework development using Testing
Upcoming Class
4 days 22 Sep 2025
Salesforce
- Salesforce Configuration Introduction
- Security & Automation Process
- Sales & Service Cloud
- Apex Programming, SOQL & SOSL
Upcoming Class
1 day 19 Sep 2025
Business Analyst
- BA & Stakeholders Overview
- BPMN, Requirement Elicitation
- BA Tools & Design Documents
- Enterprise Analysis, Agile & Scrum
Upcoming Class
1 day 19 Sep 2025
MS SQL Server
- Introduction & Database Query
- Programming, Indexes & System Functions
- SSIS Package Development Procedures
- SSRS Report Design
Upcoming Class
1 day 19 Sep 2025
Data Science
- Data Science Introduction
- Hadoop and Spark Overview
- Python & Intro to R Programming
- Machine Learning
Upcoming Class
8 days 26 Sep 2025
DevOps
- Intro to DevOps
- GIT and Maven
- Jenkins & Ansible
- Docker and Cloud Computing
Upcoming Class
7 days 25 Sep 2025
Hadoop
- Architecture, HDFS & MapReduce
- Unix Shell & Apache Pig Installation
- HIVE Installation & User-Defined Functions
- SQOOP & Hbase Installation
Upcoming Class
8 days 26 Sep 2025
Python
- Features of Python
- Python Editors and IDEs
- Data types and Variables
- Python File Operation
Upcoming Class
2 days 20 Sep 2025
Artificial Intelligence
- Components of AI
- Categories of Machine Learning
- Recurrent Neural Networks
- Recurrent Neural Networks
Upcoming Class
16 days 04 Oct 2025
Machine Learning
- Introduction to Machine Learning & Python
- Machine Learning: Supervised Learning
- Machine Learning: Unsupervised Learning
Upcoming Class
29 days 17 Oct 2025
Tableau
- Introduction to Tableau Desktop
- Data Transformation Methods
- Configuring tableau server
- Integration with R & Hadoop
Upcoming Class
8 days 26 Sep 2025
 Jan 07, 2025
  843.4k


 Tabular reports are good for creating a complete list of records or a single grand total. It cannot be used to create a group of charts and cannot be accessed in the dashboard unless the number of rows is limited. Examples of tabular report format include mailing lists and activity reports. Let us learn how to create a Tabular report in the Salesforce.
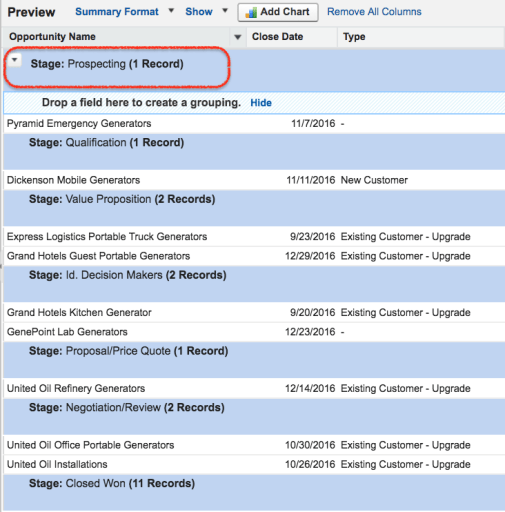

 When we compare at a glance view of two report formats like Summary and Matrix then the second one is always easy to read and understand. Now, you must be sure why matrix reports are necessary for an organization. Let us see together how to build a matrix report ahead.
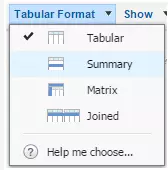

 In this way, you can create reports in different formats based on project requirements. Creating and maintaining a report is always easy with the right approach and process. In case of any doubt, you should join our Salesforce certification training course for practical learning.


 May 05, 2023
 282.8k