Month End Offer : Get 30% OFF + $999 Study Material FREE - SCHEDULE CALL
Unsupervised learning algorithms can be used to "learn" patterns hidden inside unlabeled data sets to elucidate similarities or regularities that may be present. Clustering and association are two examples of common tasks that may be performed unsupervised. Clustering methods, such as K-means, organize items in a dataset such that they are more comparable to other objects in the same cluster as opposed to objects in a different cluster to facilitate the process of discovering commonalities within the dataset. Using criteria such as minimum distances, density of data points, graphs, or other statistical distributions, the data is clustered into clusters to make it easier to analyze. Understanding k-means clustering in data mining begins with understanding data science; you can get an insight into the same through our Data Science training.
Clustering is the process of grouping similar themes together to locate them in a body of material, whether it is a document or search results. K-means helps organize data into clusters by grouping data points that are similar and lowering the mean distance between geometric points. To do this, it splits the datasets into a predetermined number (the K) of non-overlapping subgroups (or clusters) and assigns each data point to the cluster with the mean cluster center closest to it. This process is carried out in an iterative manner.
When looking for unlabeled data sets, it is usual practice to use K-means as a clustering algorithm because of its widespread use. It is now used in a broad variety of commercial situations, including but not limited to putting together collections of photographs or color palettes that are similar to one another. You can also check out the data science certification guide to understand more about the skills and expertise that can help you boost your career in data science and data transformation in data mining.
The process of identifying data that varies from the typical pattern is called anomaly detection. In semi-supervised learning, clusters are used with a reduced labeled data set, and supervised machine learning to give more accurate predictions. This type of learning can be more effective than traditional supervised learning.
K-means clustering is a popular unsupervised machine learning algorithm that groups similar data points together. It is commonly used in various fields, such as data analysis, image segmentation, and market research. In this guide, we will discuss the step-by-step process of working with K-means clustering.
Step 1: Choose the Number of Clusters
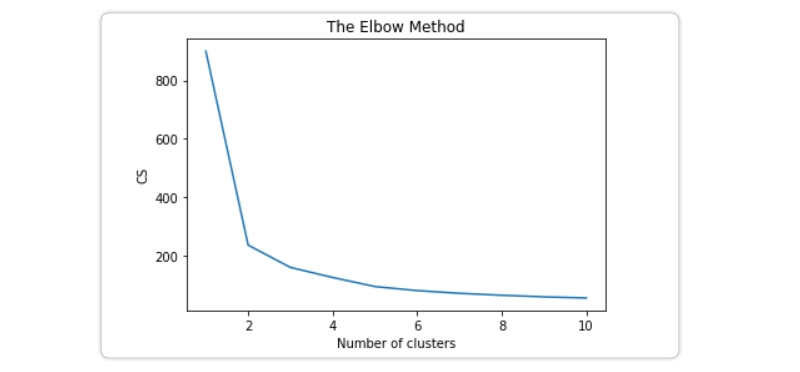
The first step in K-means clustering is to decide on the number of clusters you want to create. This decision can be based on prior knowledge or techniques like the elbow method or silhouette score.
Step 2: Initialize Centroids
Next, randomly select k data points from your dataset as initial centroids for each cluster.
Step 3: Assign Data Points to Their Nearest Centroid
For each point in your dataset, calculate its distance from all k centroids and assign it to the nearest centroid's cluster.
Step 4: Recalculate Centroids
After assigning all data points to their respective clusters, recalculate the centroid for each cluster by taking the mean value of all its assigned points' coordinates.
Step 5: Repeat Steps 3-4 Until Convergence
Repeat steps three and four until there are no more assignment changes or when a maximum iteration limit is reached.
K-means. The k-means algorithm for partitioning, where each cluster’s center is represented by the mean value of the objects in the cluster.
Input:
Output:
Method:
(1) Arbitrarily choose k objects from D as the initial cluster centers;
(2) Repeat
(3) (Re)assign each object to the cluster to which the object is the most similar, based on the mean value of the objects in the cluster;
(4) Update the cluster means, i.e., calculate the mean value of the objects for each cluster;
(5) Until no change;
K-means clustering relies on forming extremely efficient clusters to get the desired results. However, determining how many clusters to use is a difficult process. This article discusses the best approach to determining the value of K or the ideal number of clusters. You can find the procedure outlined below:
Finding the best cluster size using the Elbow approach is a common practice. The approach in question relies on the WCSS value idea. The sum of all the differences in a cluster is called the WCSS, or the Within Cluster Sum of Squares. Below is the algorithm for determining the worth of WCSS (for 3 clusters):
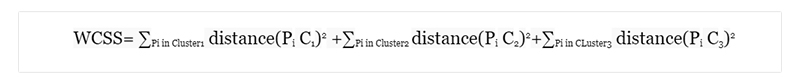
The WCSS formula shown above includes the
The first term, denoted by Pi in Cluster1 distance(Pi C1)2, is the square sum of the distances between each data point and the centroid inside cluster1, and the second and third terms are the same.
Any distance measure, such as the Euclidean or Manhattan, may be used to determine how far apart data points are from the centroid.
from sklearn.cluster import KMeans
cs = []
for i in range(1, 11):
kmeans = KMeans(n_clusters = i, init = 'k-means++', max_iter = 300, n_init = 10, random_state = 0)
kmeans.fit(X)
cs.append(kmeans.inertia_)
plt.plot(range(1, 11), cs)
plt.title('The Elbow Method')
plt.xlabel('Number of clusters')
plt.ylabel('CS')
plt.show()
Resuly
from sklearn.cluster import KMeans
kmeans = KMeans(n_clusters=2,random_state=0)
kmeans.fit(X)
labels = kmeans.labels_
# check how many of the samples were correctly labeled
correct_labels = sum(y == labels)
print("Result: %d out of %d samples were correctly labeled." % (correct_labels, y.size))
print('Accuracy score: {0:0.2f}'. format(correct_labels/float(y.size)))
When given N samples X, the k-means method clusters them into K distinct groups C, each of which is defined by its own mean j. Commonly, the means are referred to as cluster centroids.
The K-means algorithm uses the inertia, or within-cluster sum of squared criteria, to choose which centroids to select.
The following are the steps taken by the elbow technique to determine the best possible number of clusters:
# This Python 3 environment comes with many helpful analytics libraries installed
# It is defined by the kaggle/python docker image: https://github.com/kaggle/docker-python
# For example, here's several helpful packages to load in
import numpy as np # linear algebra
import pandas as pd # data processing, CSV file I/O (e.g. pd.read_csv)
import matplotlib.pyplot as plt # for data visualization
import seaborn as sns # for statistical data visualization
%matplotlib inline
# Input data files are available in the "../input/" directory.
# For example, running this (by clicking run or pressing Shift+Enter) will list all files under the input directory
import os
for dirname, _, filenames in os.walk('/kaggle/input'):
for filename in filenames:
print(os.path.join(dirname, filename))
# Any results you write to the current directory are saved as output.
from sklearn.cluster import KMeans
kmeans = KMeans(n_clusters=2, random_state=0)
kmeans.fit(X)
kmeans.cluster_centers_
For data clustering, the KMeans method divides samples into n equal-variance groups by minimizing the inertia or within-cluster sum-of-squares. Inertia, also known as the sum of squares criteria within a cluster, is a common way to evaluate a cluster's internal cohesion.

Data Science Training
K Means clustering is a powerful unsupervised learning algorithm that can help businesses and organizations make sense of large datasets. By grouping similar data points together, it can reveal patterns and insights that might have been otherwise hidden. However, it's important to remember that k Means clustering is just one tool in the data scientist's toolbox and should be used alongside other techniques for maximum effectiveness.
Ultimately, whether you're working with customer segmentation data or trying to identify anomalies in your network traffic logs - k Means clustering can unlock new insights and drive better decision-making across a wide range of industries. So why not give it a try today? Who knows what secrets might be hiding within your own dataset waiting to be discovered? Learn about neural network guides and python for data science if you are interested in further career prospects in data science.

Basic Statistical Descriptions of Data in Data Mining
 May 11, 2023
  12k
12k
What is Model Evaluation and Selection in Data Mining?
Mar 28, 2023 12k

Rule-Based Classification in Data Mining
Mar 27, 2023 11.6k
Cyber Security

QA

Salesforce

Business Analyst

MS SQL Server

Data Science

DevOps

Hadoop

Python

Artificial Intelligence

Machine Learning

Tableau
Download Syllabus
Get Complete Course Syllabus
Enroll For Demo Class
It will take less than a minute
Tutorials
Interviews
You must be logged in to post a comment


