Month End Offer : Get 30% OFF + $999 Study Material FREE - SCHEDULE CALL
Evaluation of clustering is a popular data analysis method that groups similar data points into clusters. To guarantee that the resulting clusters are relevant and helpful for the task at hand, a clustering solution's quality is essential. As a result, evaluation of clustering algorithms is a critical step in data analysis. Several methods for clustering evaluation metrics include visual, relative, internal, and external assessment. Each method has advantages and disadvantages, and the particular problem and data characteristics determine the method used. In this context, it is critical to employ multiple evaluation methods to ensure a thorough assessment of the clustering solution. Understanding clustering evaluation metrics in data mining begins with understanding data science; you can get an insight into the same through our Data Science Training.
An overview of the significance of evaluating clusters in data mining is given in this opening statement, which also prepares the ground for a more in-depth talk on various evaluation techniques.
Clustering is a popular method in data analysis and machine learning for grouping similar data points into clusters. Evaluation of clustering aims to find a method to partition a dataset into groups so that the data points within each group are more similar to each other than those in other groups. As an unsupervised learning technique, clustering does not use predetermined labels or goal variables to classify the data.
Clustering can be used for a variety of uses, such as data compression, image segmentation, anomaly detection, and customer segmentation. For clustering, several algorithms are available, including k-means, hierarchical clustering, and density-based clustering. The selection of an algorithm is based on the nature of the issue at hand, and the characteristics of the data, and each algorithm has strengths and weaknesses.There are several ways to assess the resulting clustering solution, including external, internal, relative, and visual evaluation. It is essential to evaluate clustering to ensure the resulting clusters are relevant, clearly defined, and helpful for further analysis.
The process of evaluating clusters solution derived from a clustering algorithm is called clustering evaluation. The evaluation of clustering is a method for assembling related data points into clusters. The clustering solution that is ultimately produced might not always be the best or most practical for the job at hand. Therefore, it's critical to assess the clustering method to ensure the clusters are relevant, clearly defined, and helpful for future analysis. Numerous ways of evaluating clusters include external, internal, relative, and visual techniques.
Each approach offers a unique viewpoint on the clustering solution and enables us to rate the quality of the result using various standards. The clustering process must be evaluated to ensure that the resulting groups are helpful for additional analysis, such as classification, prediction, or decision-making.
Ensuring the clusters are appropriate and useful for the task at hand involves evaluating the quality of a clustering solution.
There are various techniques for evaluating clusters, such as:
1. External Evaluation
This involves comparing the clustering solution to a known ground truth, such as a collection of already labeled data. When the ground truth is available, this technique is helpful, but it is not always practical or feasible to obtain.
2. Internal Evaluation
In order to do this, the clustering answer must be assessed in light of both the evaluation of clustering algorithm's properties and the data's characteristics. Internal evaluation metrics that are commonly used include cluster cohesion, cluster separation, and silhouette score.
3. Relative Evaluation
In order to decide which clustering approach is superior, various clustering methods must be compared. The Calinski-Harabasz index and the Davies-Bouldin index are common metrics for comparative assessment.
4. Visual Evaluation
This involves visualizing the clustering solution to determine whether the clusters are meaningful and helpful. Despite being subjective, this approach can be helpful in determining whether the clustering solution is suitable for the task at hand.
Clustering evaluation metrics are used to evaluate the quality and efficacy of evaluating clustering algorithms in grouping similar data points into clusters. Since there are no pre-established class names for the data, clustering is an unsupervised learning technique. As a result, evaluating the quality of clustering results can be difficult.
Researchers can compare various evaluation of clustering algorithms, optimize clustering algorithm parameters, or determine the suitable number of clusters to use in the analysis by evaluating the quality of clustering results. The clustering evaluation metric chosen will be determined by the objectives of the analysis and the available data information. Let's dive more into the topic of evaluating clustering and learn more about its importance in data science or data mining and key takeaways. You should check out the data science tutorial guide to brush up on your basic concepts.
Here are more detailed explanations of the four kinds of clustering evaluation metrics discussed earlier:
Internal clustering evaluation metrics assess the quality of clustering results based solely on the data itself, without reference to any exterior information or labels. These metrics are helpful when there is no ground truth available or when the true class labels are unknown or unreliable.
Silhouette Coefficient- Measures cluster density and separation. A greater silhouette score means that the data points in a cluster are more similar to one another than they are to the points in other clusters.

Calinski-Harabasz index- The ratio of variation between clusters to variance within clusters. A higher Calinski-Harabasz index shows that the clusters are distinct and well-separated
Davies-Bouldin index- The average resemblance between each cluster and its most similar cluster is compared to the average dissimilarity between each cluster and its least similar cluster. A lower Davies-Bouldin index suggests better cluster separation.

Dunn Index- Dunn Index is almost the same as DB Index: both get better when the clusters are dense and well-spaced. But as the performance improves, the Dun index gets increases.
Dunn Index is different from the DB index in terms of how the problem is approached. DB index works with the dispersion and separation of all clusters. In contrast, the Dunn index only considers the worst cases in the clustering, i.e. the closely packed clusters and also the single most dispersed cluster. It really depends upon you what approach to work with.

Here i, j, and k are each index for clusters, d measures the inter-cluster distance, and d’ measures the intra-cluster difference.
External clustering evaluation metrics assess the quality of clustering findings by comparing them to external criteria or labels, such as the data's true class labels. These metrics are helpful when the ground truth is known or available.
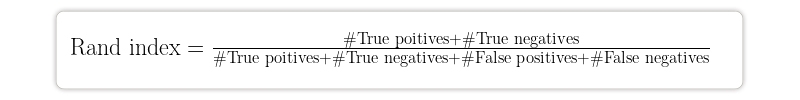
Rand Index- Measures the proportion of data points in the same or distinct clusters based on clustering findings and true class labels. A higher Rand index shows superior agreement between the clustering results and the true class labels.
Adjusted Rand Index- Adjusts the Rand index for chance agreement, considering the number of clusters and the distribution of data points among them. After accounting for chance agreement, a higher Adjusted Rand index shows better agreement between the clustering findings and the true class labels.

By leveraging the anticipated similarity between the clusters, ARI creates a baseline. In contrast to RI, it can produce negative numbers if RI is lower than the anticipated RI.
Fowlkes-Mallows Index- Calculates the geometric mean of the precision and recall of the clustering findings in relation to the true class labels. A higher Fowlkes-Mallows index shows better agreement between the clustering results and the true class labels.
Normalized Mutual Information- Measures the mutual information between the clustering findings and the actual class labels, normalized by the entropy of the two distributions. A higher Normalized Mutual Information shows stronger agreement between the clustering results and the true class labels.

I(Ω; C) stands for reciprocal information. It gauges the degree to which learning about the clusters advances our understanding of cluster 3.
I(Ω; C)=0 means we are unsure about the class to which a cluster belongs.
I(Ω; C)=1 Every cluster is mapped to a class.
Relative clustering evaluation metrics compare the quality of clustering outcomes for various algorithms or parameter settings. These metrics are helpful when comparing various clustering algorithms or parameter settings.
Visual clustering evaluation metrics evaluate the quality of clustering findings based on their visual representation, such as scatter plots, heatmaps, or dendrograms. These metrics are helpful for identifying patterns and trends in data that may not be apparent from quantitative metrics alone.
Visual assessment of cluster separation and compactness- Based on their visual depiction, this function determines the clusters' degree of separation and compactness. Clusters that are well-separated and compact are regarded to be of higher quality than overlapping or diffuse clusters.
The clustering method is determined by the characteristics of the data as well as the issue at hand. It is important to select a suitable clustering method to ensure that the resulting clusters are meaningful, well-separated, and useful for further analysis.
There are several clustering methods, which can be generally classified into the following types:
Centroid-based Clustering
Centroid-based evaluation of clustering algorithms, such as k-means, divide the data into k groups, where k is a user-defined parameter. Each cluster is symbolized by its centroid, which is the mean of all the data points in the cluster. The algorithm allocates data points to the nearest centroid iteratively, updates the centroid, and repeats until convergence.

Hierarchical Clustering
Hierarchical evaluation of clustering algorithms create a tree-like hierarchy of groups. Agglomerative clustering begins with each data point as a single cluster and then iteratively merges the two closest clusters until all data points belong to one cluster. Divisive clustering begins with all data points in one cluster and then recursively divides them until each data point is in its own cluster.

Density-Based Clustering
Density-based evaluation of clustering algorithms, such as DBSCAN (Density-Based Spatial Clustering of Applications with Noise), group data elements based on their density. High-density areas are identified as clusters, while low-density regions are identified as noise. These algorithms are helpful for data of any shape and density.

Distribution-Based Clustering
Distribution-based evaluation of clustering algorithms, such as Gaussian mixture models, presume that a probabilistic model generates the data. They apply the model to the data and use it to partition the data into clusters. These algorithms are helpful for data with well-defined distributions.

Graph-Based Clustering
Graph-based clustering algorithms, such as spectral clustering, treat data as a graph and divide it into groups. These algorithms are helpful for data with complex relationships.
Fuzzy Clustering
Fuzzy clustering algorithms, such as fuzzy C-means, give each data point a degree of membership between 0 and 1 to each cluster. This enables data points to belong to multiple clusters at the same time.
Spectral Clustering
This technique clusters the data based on its spectrum characteristics. It works by building a similarity matrix between data points and applying a clustering algorithm to the matrix's eigenvectors. Spectral clustering is particularly useful when the data points have a nonlinear relationship.
Overall, clustering methods provide an efficient way to evaluate and comprehend complex data sets by grouping similar data points together. The nature of the data and the challenge determines the clustering method selected.

Data Science Training
Evaluating the quality of clustering results is an essential aspect of clustering analysis. Clustering evaluation metrics can assist researchers in assessing the efficacy of various evaluating clustering algorithms and determining the appropriate number of clusters to use in the analysis.
Evaluation of clustering metrics come in various forms, such as relative, internal and exterior, visual, and relative metrics. Each of these metrics provides a unique view of the quality of the clustering results and can be used for various purposes. The objectives of the analysis and the information that is accessible about the data must be taken into consideration when selecting the best clustering evaluation metric. Finally, a thorough examination of clustering results can result in more accurate and meaningful data interpretations. You can also learn about neural network guides and python for data science if you are interested in further career prospects in data science.

Basic Statistical Descriptions of Data in Data Mining
 May 11, 2023
  12.1k
12.1k
What is Model Evaluation and Selection in Data Mining?
Mar 28, 2023 12.1k

Rule-Based Classification in Data Mining
Mar 27, 2023 11.7k
Cyber Security

Data Science

QA

Salesforce Service Cloud

AWS
Download Syllabus
Get Complete Course Syllabus
Enroll For Demo Class
It will take less than a minute
Tutorials
Interviews
You must be logged in to post a comment


