Grab Deal : Flat 30% off on live classes + 2 free self-paced courses - SCHEDULE CALL
Any project using machine learning must place a significant emphasis on selecting and model evaluation in order to be successful. We will assess how well our model works at this point in the procedure. In order to establish the further measures that need to be taken to improve this model, we conduct an analysis of more in-depth performance indicators. If you ignore this step, your model's performance will likely not be as good as it may be. To begin the process of increasing our model's accuracy on our dataset from 65% to 80% or 90%, we must first understand what our model predicts accurately and incorrectly. For better understanding, you can check out data science online certification courses to learn more about understanding and optimizing the model's features and parameters to achieve the desired accuracy.
Model Selection is the process of deciding which learning technique to use to model our data; for example, while attempting to solve a classification issue, we may consider using Logistic Regression, Support Vector Machines, trees, and other methods. It is also necessary to make choices on the degree of linear regression techniques while solving a regression problem.
Model Evaluation is a process to ascertain how well our model performs on a dataset it has not seen (its generalization capabilities). During the evaluation, a model's ability to perform well on various metrics such as accuracy, precision, recall, F1-score, and AUC-ROC is assessed by testing how well it can generalize to new data.
For regression and classification, we have spoken about how to fit models by minimizing error or maximizing likelihood given a dataset (also referred to as "training data"). This works well if we need to utilize our model for inferential or explanatory purposes. Or when we employ less adaptable models like linear regression or logistic regression.
However, when our focus moves from descriptive analysis to predictive modeling using methods like non-linear regression, Tree-based approaches, and Support Vector Machines, this is frequently no longer enough.
Our objective is to construct models that are generalizable beyond the available data set. It is easy for complex models to overfit our training data, in which case we don't get any insight into the population from which we sampled our training data. We state that our goal is to "learn" or "train" models that can extrapolate previously unknown data from the same population beyond what was included in the training set.
As you may see, this creates a little bit of a problem. What metrics can we use to evaluate a model's predictive capability when we can only use training data?
Cross-validation is often used as a benchmark for measuring how well a model generalizes to new data. It plays a role in two crucial steps of data analysis: model selection and evaluation.
Model Complexity Selection is the process of deciding what kind of model to use. Take a look at this illustration of linear regression: What variables, interactions, and data transformations should I account for when fitting a linear regression model? Which depth of classification tree to employ is another illustration.

The error rate in a test may be estimated by cross-validation because it is a resampling technique (or any other performance measure on unseen data). Sometimes you'll have access to a sizable predetermined test dataset you should never use for training. If you don't have access to a dataset like this, cross-validation can help.The purpose of Model Assessment is to evaluate the model's overall performance. Take the linear regression models I constructed, where I used a limited set of variables as predictors. If we give it some data we haven't seen before, how well will it do? In the same vein, how can a classification tree answer the same query? (of specific depth).
Any given model can be evaluated with the validation set. However, this is for regular evaluations. As engineers specializing in machine learning, we use this information to adjust the model's hyperparameters. Therefore, the model occasionally encounters this information but never uses it to "Learn." Higher-level hyperparameters are updated based on the findings from the validation set. Therefore, a model is indirectly affected by the validation set. You may also hear the term "Dev set" or "development set" used to refer to the validation set. This makes sense, as the dataset is helpful during the model's "development" phase.
The Test dataset serves as the benchmark against which the model is tested. Only once a model has been fully trained is it put to use (using the train and validation sets). To compare several models, the "test set" is typically employed (For example, on many Kaggle competitions, the validation set is released initially along with the training set, and the actual test set is only released when the competition is about to close, and it is the result of the model on the Test set that decides the winner). However, utilizing the validation set as the test set is not recommended. There is a high standard of curation across the test set. As such, it includes representative samples of data from all relevant classes that the model would encounter in practice. All these continuous characteristics are a requirement for many different types of data mining project ideas in the real world.
Now that you understand the functions of these datasets, you may seek guidance on how to divide your data into a Train, Validation, and Test set.
There are two primary factors at play here. First, the model you are training, and second, the total amount of samples in your data.
Some models require enormous amounts of data to train, in which case you should prioritize the more extensive training sets. For models with few hyperparameters, a smaller validation set may suffice. Still, if your model has numerous hyperparameters, a larger validation set is recommended (although you should also consider cross-validation).
Further, a validation set is unnecessary if your model has no hyperparameters or ones that are difficult to adjust.
Overall, the train-test-validation split ratio, like many other aspects of machine learning, is very application-dependent, and it becomes simpler to make judgments as more and more models are trained and built.
There may be sampling problems with this method. Since the error rate is a random quantity that is influenced by the number of observations in both the training and validation sets, it can fluctuate widely. By averaging together several readings, we may get a more accurate approximation of the test error (remember the law of large numbers). To achieve this, we will run our validation resampling procedure 10 times (using new validation and training sets each time) and take the mean of the test errors.
This method is not without its flaws. In our validation strategy, we exaggerate errors since each training set only uses half of the data to train. This means that our models may not perform as well as those trained with the complete dataset. It is possible to rethink and apply our strategy to this problem thoroughly. Create individual validation sets for each training point.
Method: (a) for each observation I in the data set,
(b) predict the reaction to the i-th observation,
(c) calculate the prediction error.
The resulting error estimate from the cross-validation procedure is as follows.
CV(n)=1n1(i-i)2
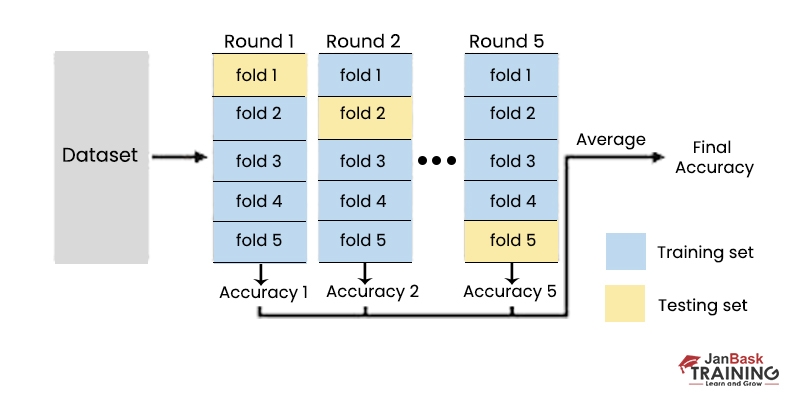
The data set is shuffled and then divided into k groups at random to implement the cross-validation method. Iterating over each subset requires treating that subset as a test set while combining the remaining subsets into a single training set. A test group is used to validate the model, and this procedure is repeated k times.
By the end of the procedure, k distinct sets of data have been collected from k distinct test populations. Choosing the model with the greatest score makes it easy to determine which one is the best. Our Data science tutorial will help you to explore the world of data science and prepare to face the challenges.
A variety of measures may be used to assess the quality of a model. However, selecting an appropriate metric for assessment is typically difficult and is highly dependent on the nature of the problem being handled. The evaluator's ability to quickly and accurately match the issue statement with an acceptable statistic depends on his or her thorough familiarity with a wide variety of metrics.
Consider two hypotheses, h(x) and h', for performing a given task: (x). We wouldn't have any way to compare which one is superior. To put it simply, we could adopt the following measures at a high level:
If there are competing hypotheses, choose the one with the best results. If not, we can't conclude whether h(x) or h'(x) is superior using statistical methods.
When evaluating a model's performance on a classification job, we'll look at how well it can correctly place instances into classes. Think about it in binary terms. Our school has two different types of students: 1st and 0th. A successful prediction would be one in which the model correctly identifies an instance as belonging to either Class 1 or Class 0. A table outlining all the potential outcomes of our model may be constructed if we treat our 1 class as the "Positive class" and our 0 class as the "Negative class."

Data Science Training
The accuracy measure is the easiest to define; it is just the fraction of test instances that were labeled correctly. While it is applicable to a wide variety of general situations, its use is limited when dealing with imbalanced data sets. When investigating bank data for fraudulent activity, the ratio of fraudulent to non-fraudulent instances might be as high as 1:99. A 99% accurate model in this situation would correctly identify all test instances as not being fraudulent. There will be no utility for a model that is just 99% correct.A model will fail to capture 10 instances of fraud if it is inadequately trained to predict that all 1000 data points are not frauds. Measures of accuracy reveal that the model makes 990 out of 1000 correct predictions, giving it an accuracy of (990/1000)*100 = 99%.
Since the model failed to account for 10 key indicators of fraud, we need a metric that can zero in on these red flags. Because of this, accuracy is not a reliable measure of a model's efficacy.
In order to determine whether or not a categorization is accurate, precision is employed as a measure.This formula is the proportion of true positive classifications relative to the sum of all true positive predictions. The higher the accuracy or the model's propensity to accurately identify the positive class, the higher the proportion.The necessity for exactness is seen in the predictive maintenance problem (determining when a machine will break down and arranging for repairs in advance). Incorrect projections may be costly for a business because of the high price of upkeep. The model's accuracy in identifying members of the positive class and its capacity to reduce false positives are of the utmost importance in such circumstances.
The percentage of positive instances that were properly detected, or recall, is expressed as a percentage of the total number of positive cases.Regarding the fraud issue, again, the recall value may prove to be rather helpful in situations of fraud, as a high recall value will imply that a large percentage of frauds were successfully discovered.
In order to strike a proper balance between the two factors, Recall and Precision, the F1 score is the harmonic mean of the two.It helps when you need to remember something and be precise about it, as when trying to figure out which plane pieces need fixing. Here, accuracy is needed to cut costs for the business (plane components are quite pricey), and recall is essential to ensure the machinery is safe and doesn't endanger people.
The ROC curve represents a relationship between the proportion of correct diagnoses (recall) and the proportion of incorrect diagnoses (false positives, or TN/(TN+FP)). Area Under the Receiver Operating Characteristics (AUC-ROC) measures how well a model predicts actual results.

The model predicts the output variable randomly if the curve is close to the 50% diagonal line.
Model evaluation and selection is a crucial step in the machine learning process. It helps ensure that models are accurate, reliable, and efficient. By understanding the different metrics used for evaluation and knowing how to choose the right algorithm for your data, you can create robust models that drive real results. Remember to pay attention to the bias-variance tradeoff when selecting models as well as feature importance when dealing with large datasets.
As you move forward on your machine learning journey, keep these critical points in mind and always strive for continuous improvement through ongoing testing and iteration of your models. With these skills under your belt, you'll be able to build cutting-edge AI systems that revolutionize industries across the board. Understanding model evaluation and selection in data mining begins with understanding data science; you can get an insight into the same through our data science certification guide.
Check out our community page about data science in the data science community.

Basic Statistical Descriptions of Data in Data Mining
 May 11, 2023
  10.5k
10.5k Mar 03, 2023 10.1k

Rule-Based Classification in Data Mining
Mar 27, 2023 10k
Cyber Security

QA

Salesforce

Business Analyst

MS SQL Server

Data Science

DevOps

Hadoop

Python

Artificial Intelligence

Machine Learning

Tableau
Download Syllabus
Get Complete Course Syllabus
Enroll For Demo Class
It will take less than a minute
Tutorials
Interviews
You must be logged in to post a comment


