Grab Deal : Flat 30% off on live classes + 2 free self-paced courses - SCHEDULE CALL
Grab Deal : Flat 30% off on live classes + 2 free self-paced courses - SCHEDULE CALL
Do you want to excel in “MS Excel”?
With nearly 750 million users worldwide, MS Excel is the perfect tool of choice for presenting data in a structured way. Since 1985 it has been catering to the needs of its users smoothly and has been proclaimed as “Microsoft’s most important consumer product”.
What makes MS Excel the ultimate tool of choice for its users?
Excel is best suited to store, analyze and report large amounts of data and is used by professionals to manage datasets. Excel has strong computing powers that makes it fit to be used for financial purposes. Excel is used to automate processes in an I.T team. A certified I.T professional knows how to keep the data safe and well-maintained in an Excel file. This can be better achieved through enrolling into our Top I.T online certification courses which are devised to turn you into a pro I.T professional from every aspect.
Apart from Data Science certification courses, a basic knowledge of MS Excel is required to crack your interview. But what are the Excel interview questions that can be asked? This blog will unfold all the important MS Excel interview questions for beginners as well as for experienced candidates.
Let’s start exploring some of the sorted Excel interview questions that will surely help you in your future ahead.
Before heading for your interview, learn about these professional tips to crack your interview in your dream company.
Answer- MS Excel is a spreadsheet that allows storage of data in the form of a table. It was developed by Microsoft in 1985 and can be operated on any operating system like Windows, MAC OS, or Android. It has built-in functions like SUM, DATE, etc that makes calculation easier. It allows eady data validation and allows data analysis in the form of pie charts or bar graphs.
This question forms one of the most asked MS Excel interview questions by an interviewer.
Answer- Cells are areas that are formed by the intersection of a row and a column in MS Excel. Cells are specifically made to store and display information. There are a total of 1,048,576 x 16,384 cells present in a single excel sheet.
This is one of the very basic MS Excel interview questions for beginners that should be answered comfortably.
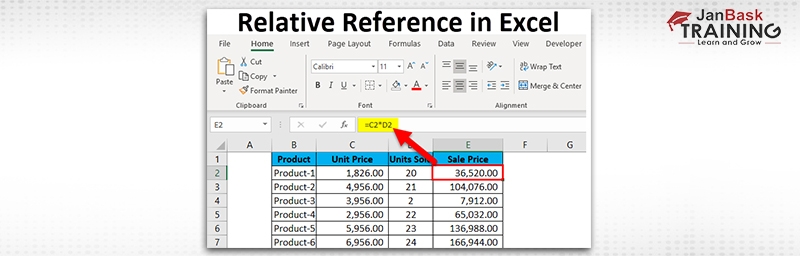
Answer- A cell address is used to find a particular cell on the spreadsheet. It is denoted by combining the respective column letter and a row number. There are two kinds of cell references, namely relative and absolute. Relative references alter when the formula is copied to a different cell. However, absolute references stay the same irrespective of being copied. For example-

Answer-
|
Relative Cell Referencing |
Absolute Cell Referencing |
|
i) In this type of referencing, there is a change when copying from one cell to another with respect to the cell address. |
i) There is no change when a cell is copied irrespective of its cell address. |
|
ii) It is present by default. |
ii) It has to be added by a dollar sign before and after the column and row address. |
|
iii) |
iii) |
These types of MS Excel interview questions can be better explained with the help of an example that draws attention of the interviewer.
Nourish your I.T skills by reading our blog on “Top I.T skills that are in demand in 2022.”
Answer- Cells refer to the boxes available in the grid of the Excel sheet. Every cell is recognized on the sheet by the reference, column letter, and row number at the cell’s location. To add a new cell in Excel, select the cell where you want to insert it and then select the ‘Insert’ option. This can be better understood with the help of an example-

Answer- In order to format MS Excel cells, you can use the commands present in the Font group of the Home tab. Some of them are- Name, Alignment, Font, Border, Fill and Protection.
These are non-technical MS Excel interview questions which do not require any example.
Answer-
|
Formula |
Function |
|
i) Formula is like an equation in Excel. It can be any type of calculation. |
i) Function is a pre-defined calculation which is already built in the excel. |
|
ii) It is time-consuming because of manual typing. |
ii) It is less time-consuming and more comfortable while working with functions. |
|
|
|
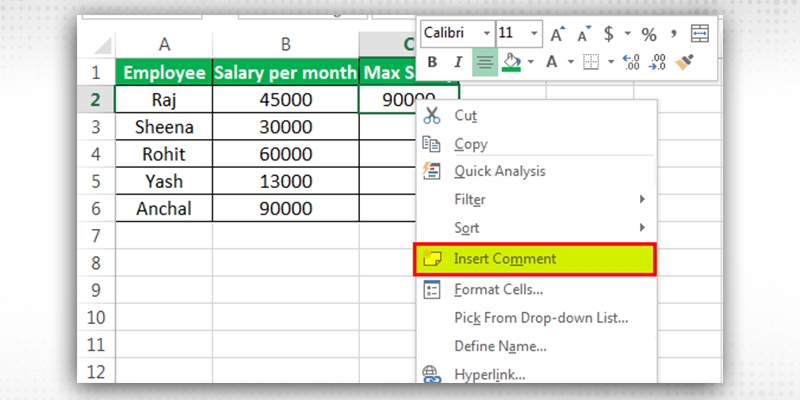
Answer- If you want to discuss data with various members, you can use a comment. Notes do not comprise a reply box. They are only meant to include annotations and reminders in the cells. When you do not want to have any discussion, simply use a note. To add comments to a cell, select the cell, right-click on it, and then select the New Comment option. These comments will be visible to everyone who can access the Excel sheet.

In these types of MS Excel interview questions, you may or may not illustrate an example.
Do you know JanBask Training offers one of the most professional I.T online training programs to its aspirants? Enroll now!
Answer- The Ribbon is basically your key interface with Excel, and it appears at the top of the Excel window. It lets users access many of the most important commands directly and consists of many tabs such as File, Home, View, Insert, etc. The MS Excel ribbon refers to the row of tabs and icons situated at the top of the Excel window that elt you rapidly detect, comprehend, and utilize commands to achieve a particular target.
This is one of the most frequently asked Excel interview questions for freshers.
Answer- To freeze panes in MS Excel, follow these steps-
Select the rows and columns you wish to freeze.
Select Freeze pane in the View tab.
Select from the three given options- Freeze panes, Freeze Top Row and Freeze First Column.
Answer- The order of operations in Excel is known as PEDMAS and it is in this way-
Answer- The Count function is often used in Excel and it has two variations- Counta and CountBlank. The Count function counts the number of cells that contain numeric values.
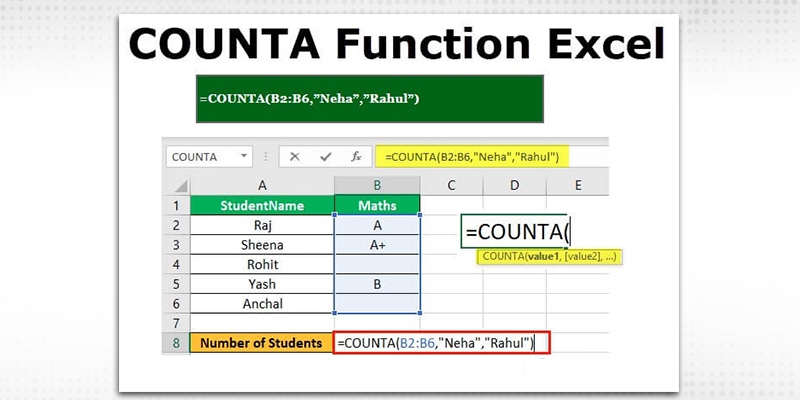
Counta- It counts the number of cells that contain a form of content. These include string values, characters and numeric values.
Countblank- It counts the number of blank cells only.
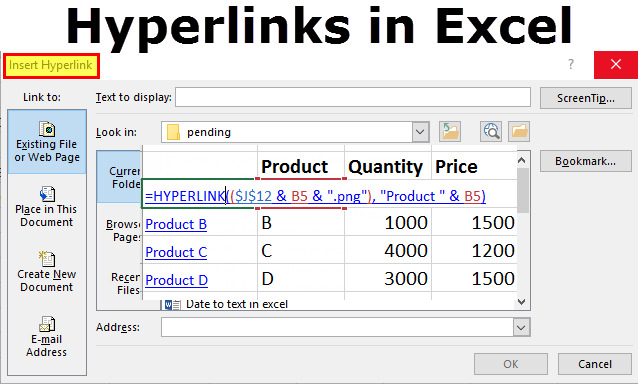
Answer- To create a hyperlink in MS Excel, the shortcut key is Ctrl+K. After this, the ‘Insert Hyperlink’ dialog box appears. Enter the address and the text to be displayed. In other words, choose the component you want to utilize as the anchor. After that, you may deploy various pathways. Choose Link from the Insert tab, right-click, and choose Link on the menu. This will produce a set of options showing the type of content you want to link.
These types of Excel interview questions are technical-based and expose the technical skills of candidates.
Answer- To add a Note, select the cell and right-click on the same. Select the New Note option and type in any note that you wish to. In case you want to delete the Note, follow the same procedure and select the Delete Note option. Notes are indicated by a red triangle at the top-right corner of the cell.
Answer- To protect a cell in a sheet from being copied, follow the steps-
i) Select the cells you want to protect.
ii) Open the Font window from the Home tab.
iii) Select Protection from the Protection pane and check the Hidden Box.
iv) Click on the Review tab and select the Protect Sheet option.
v) Specify a password for security.
Hey! There's good news for all freshers out there! Know the secret to grab an I.T job without any experience.
Answer- Macros are actions that allow you to run the operation as many times as you want. If you repeat a task in Excel, you can record a macro to perform the task automatically. On creating a macro, the mouse clicks and keystrokes are recorded. You can also edit the same to bring a few alterations to the process it works. Maco refers to an automated input order that resembles mouse actions. They are deployed to substitute a duplicate set of keyboard actions.
See the diagram below to answer better in your Excel interview questions.

Answer- To create named ranges, follow the given steps:
Do you know that MS Excel aids Data Science by allowing users to create named ranges? Get more details on Data Science by enrolling in our Data Science certification course now!
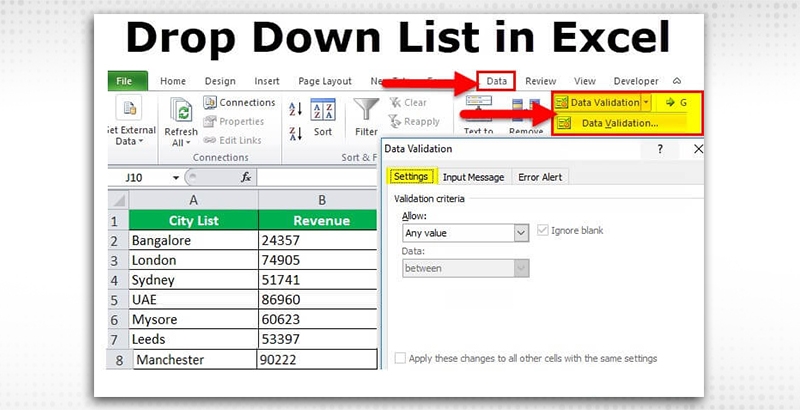
Answer- To create dropdown lists, follow the given steps:
Answer- A Pivot table is an interactive way to brief your data. It is a statistical table that condenses data with large amounts of information. It analyzes numerical data and answers unanticipated queries about your data. A pivot table is very efficient for calculating, summarizing, and examining the information helping you visualize comparisons and changes in the data. They perform differently as per the medium you are deploying to run Excel.
Answer- A Pivot table allows the display of the data to be analyzed, providing various angles to the data. With a Pivot table, data can be compared quickly with accurate reports. Pivot tables can detect different patterns and relationships and allow you to focus on important details. A pivot table summarizes huge data sets very efficiently and in no time. They also maintain flexibility in data evaluation and can produce communicative dashboards. Automatic upgrades, better data preciseness, and great report production are other pivot table features.
Answer- To create a Pivot table, follow these steps-
i) Arrange the data in a tabular form
ii) There should be a unique heading for each of the columns in the first row.
iii) The columns should contain only one type of data.
iv) There should not be any blank row or column.
v) The data in the Pivot table should not match with other data in the sheet.
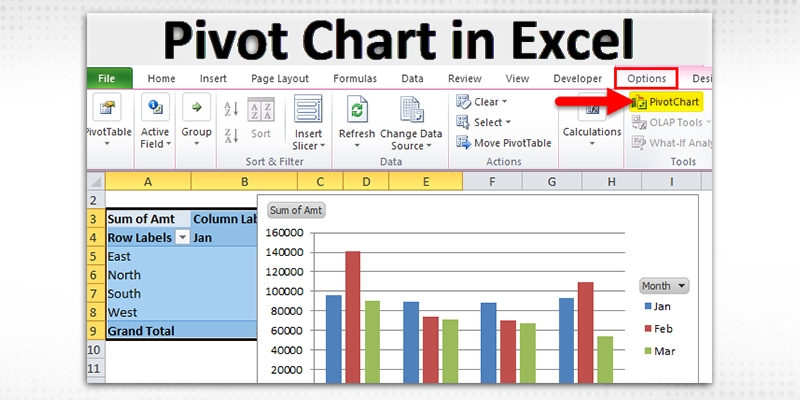
Answer- A Pivot chart adds value and category instead of choosing the chart wizard. It is a visual representation of data which allows you to analyze data using various types of graphs and layouts. It is usually needed for business presentations where there is a need for large amounts of data.
A Pivot chart in Excel looks like this-
Data Scientists work with data by creating pivot charts in Excel. Read out this interesting blog to find out “What does a Data Scientist exactly do?”
Answer-
|
VLOOKUP |
LOOKUP |
|
i) This function lets the user look for a value in the leftmost column of a table and returns the value from left to right. |
i) This function allows the user to look for data in a row/column and returns the data in another row/column. |
|
ii) It is not so easy to use. |
ii) It is easier and can replace the VLOOKUP function. |
Answer- Data Validation in Excel is a feature that allows you to control the type of data entered in the sheet. It restricts the type of values that a user can enter into a particular cell. Data Validation is present in the Data Tools group on the Data tab. Data validation verifies the validity of the data. It checks if the data is within the normal values stated for the field or not by using a set of protocols. The system guarantees that inputs abide by the rules as well.
Answer- For this, use the YEARFRAC function and put the start and end date. After that press Enter.

Answer- The different Functions available in Excel are as follows-
DAY, DATE, MONTH- Date and Time.
AND, OR, NOT, IF, TRUE, FALSE- Logical
AVERAGE, COUNT, COUNTIF, MAX, MIN- Statistical
SUM, SUMIF, PRODUCT, SIN, COS- Math and Trig
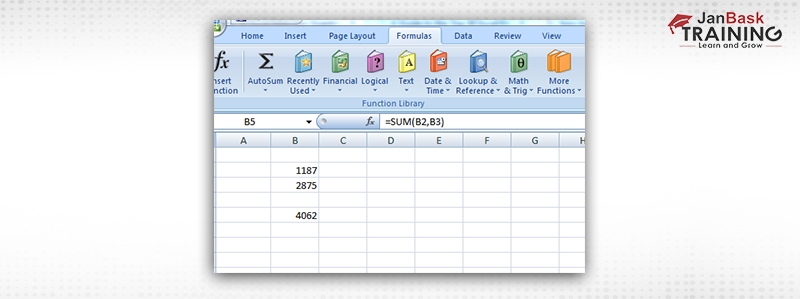
Answer- Product in Excel can be calculated by the PRODUCT function. Type any two numbers and type “=” PRODUCT and put the two numbers. The result will be displayed as shown below- 
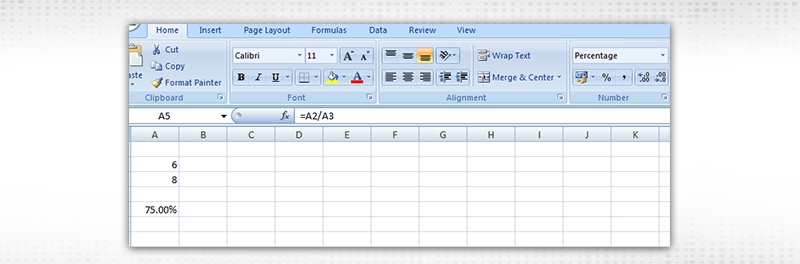
Answer- Here are the steps followed in order to obtain the result:
See the image below to understand it-
Such types of technical interview questions for Excel skills detect the technical skills of a candidate. If you want to start an I.T career, we can guide you through our blog on “I.T Career pathway.”
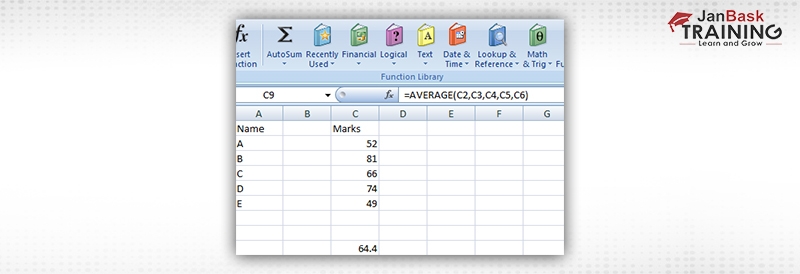
Answer- To find the average of more than one number, Select the AVERAGE formula from More Functions. In other words, click a cell located below or to the extreme right of the numbers for which you wish to calculate the average. Then, click on the arrow beside it on the home tab. After that, click average, and click on Enter.
Answer- For this, you need to use the TODAY function from the Date and Time option. This function will return the current date in the MS Excel date format.

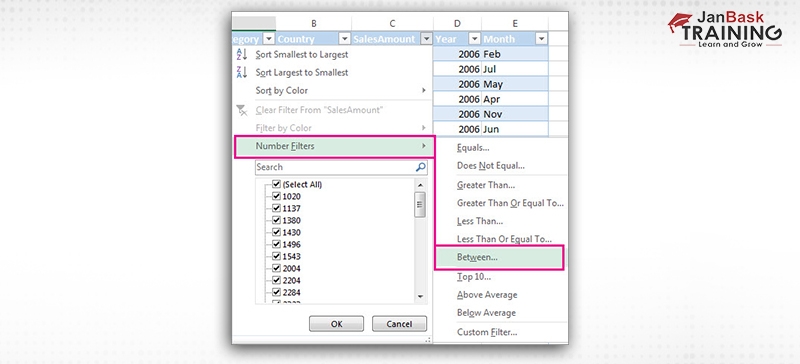
Answer- A filter in the Excel sheet refers to a function that lets you arrange data in a file. The filter receives the information from a range of cells and provides an array of data relevant to the given filter. Filters represent an automated way that modifies a list or table as per certain or various conditions. To add a filter, select a specific cell. Then select Data> Filter. After that, select the column header arrow, enter the Filter Criteria, and press OK.

Alert! Get to know the most-wanted skills by recruiters in 2022 and nurture your skills accordingly.
Answer- To calculate the sum of two numbers, select the SUM function from Math & Trig option. If you wish to perform a sum formula in the Excel sheet, go to the Home tab. Then, click on Editing group and tap on the Autosum button. Here, excel automatically includes the =SUM function. Select the range having your numbers. Press Enter on the keyboard to visualize the column summed up in the Excel sheet.
Answer- There are three report formats in Excel. They are- Compact report format, Tabular report format, and Outline report format. These are available in the Report layout menu of the Excel sheet. It is also possible to toggle between the three various report formats in the Excel sheet from the report layout menu in the Excel tool and menu bar.
Answer- The IF function in Excel performs a logical test. It allows you to make logical comparisons between a value and what you expect. An IF function can have two results- First, if your comparison is True, and second, if your comparison is False. The IF function is a very famous function available in Excel. The formula of IF-THEN is = IF (logic test, value if true, value if false). The first argument details the functions to be done if the comparison is correct. The second one discusses what’s to be done when the comparison is wrong.
Answer- This is a combination of two functions- INDEX and MATCH. The INDEX function is used to return an item from a specific position in the list, while the MATCH function is used to return the position of a value to the list. Here’s how an index-match function works in excel-
Data Scientists proactively work to bring data from different sources and analyze them. Check out what are the roles and responsibilities of a Data Scientist and their objectives.
Answer- Duplicate value refers to the value where every value in a single row is similar to all the values in a different row. A differentiation of duplicate values relies on what is seen in the cell, not the value contained in the cell. To find duplicate values in a table through Conditional Formatting, go to the Home tab and select Conditional Formatting. Then select Highlight Cells Rules and then select Duplicate Values.
Answer- Duplicate value is visible more than once in the dataset. While performing with huge databases, it is important to detect and highlight duplicate values since the user may not wish to have them. Select the highlighted cells to delete duplicate values in a cell and press the Delete button. After deleting the values, go to the ‘Conditional Formatting’ option in the Home tab and choose ‘Clear Rules’ to remove the rules from the sheet.
Answer- To protect workbooks in excel, you can adopt any of these tree options-
i) By setting a password to open workbooks.
ii) By protecting sheets from being added or deleted.
iii) By protecting Window sizes from changing.
Answer- Relative cell addresses in Excel are the default cell references. It combines a column name and a row number without the dollar sign. Whenever you copy formulas in Excel, the addresses of the cells get modified. This system is called a Relative cell address. They are the cell address in the formula that does not contain a $ sign prior to the row number. The formula calculates relevance to the position instead of showing the calculation from the actual place.
Answer- In Excel, there are three wildcards that work only with text data.
i) Asterisk (*)- Refers to any number of characters.
ii) Question mark (?)- Represents one single character.
iii) Tilde (~)- Used for identifying any wildcard character in the text.
Learn and grow with our popular Janbask Training e-learning community and forum.
Answer- The What-if Analysis is the process of changing the values in cells to see how these changes affect the results in Excel. It is a powerful tool for carrying out complex mathematical calculations and data experimentation. There are three kinds of What-if Analysis in Excel. They are- Scenarios, Goal Seek and Data Tables. These take the input values of various data and display the results.
This is one of the most common MS excel interview questions and answers for experienced candidates.
Answer-
|
Function |
Subroutine |
|
i) It is responsible for returning the value of a task. |
i) It does not return the value of a task it is performing. |
|
ii) They are used in a fixed way in spreadsheets or formulas. |
ii) They are not used directly in spreadsheets or formulas. |
|
iii) They are used to carry out repetitive tasks. |
iii) In this case, ussr are required to insert a value before the output. |
|
iv) They are called by a variable. |
iv) they can be recalled anywhere. |
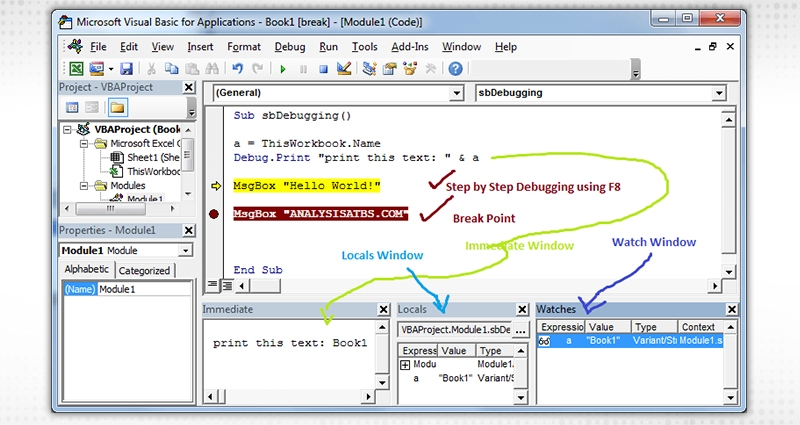
Answer- A VBA code in Excel refers to a human-legible and editable code created after recording a macro. To debug a code, use the F8 key. You can also create a breakpoint from where you want the termination of execution. The execution will start from the beginning of the code, and every time you press F8, it will execute the next line and continue until the end of the code. The yellow arrow and the highlighted line tells you the current point to execution.
Answer-
Capacity Area(Length As Double, Optional Width As Variant)
In the event that IsMissing(Width)
Region = Length * Length
Else
Region = Length * Width
End If
The increased dependence of the organizations on Big Data has led to the increased demand for certified Data Scientists professionals whose salaries remain high due to the gap in demand and supply. Check this blog to know more about a Data Scientist’s salary based on different factors.
Answer- Loops are one of the most powerful programming tools in VBA. They allow users to repeat the same code block until a specific point or condition is attained. In VBA, Loops allow you to go through a set of objects/ values multiple times. After the condition is met, the program carries out the following part of the code. It is very essential to know how to utilize loops properly. Loops in VBA let you revise a range of objects and examine it one after the other.
Answer- Open the VBA editor with the shortcut Alt+F11. Then, on the left side of the project explorer, double-click “ThisWorkbook”. Input the code “Private Sub Workbook_Open()” and hit the enter key. Next, write the recorded code between “Private Sub Workbook_Open()” and “End Sub”. After you close the VBA editor, save your workbook in Excel Macro-Enabled Workbook (XLSM) format.
Answer- ADO stands for Activex Data Objects and is used to access data between client and server. This is Microsoft’s universal data-access technology. It can be used to extract any type of data from the source. There are three versions of ADO. They are- 2.1, 2.5, and 2.6. Basically, ADO in MS Excel and VBA refers to a tool that assists developers in penning down VBA code to get data without understanding how the database is used.
Answer- Function Area(Length As Double, Optional Width As Variant)
If IsMissing(Width) Then
Area = Length * Length
Else
Area = Length * Width
End If
End Function
Answer- To find the last row, use the instructions given accordingly:
Sub FindingLastRow()
Dim lastRow As Long
lastRow = ActiveSheet.Cells.SpecialCells(xlLastCell).Row
MsgBox (lastRow)
End Sub
Answer-
|
ThisWorkbook |
ActiveWorkbook |
|
i) Indicates the name of the workbook from where the code is running. |
i) This is the workbook that is presently active from the other open workbooks. |
When it comes to last minute interview tips, there are certain expert tips that will enable you to ace your interview.
Answer- There are eleven data formats present in Microsoft Excel to store the data. They ate as follows:
Answer- Charts are used in MS Excel to support the graphical representation of the information. The user can utilize any form of chart, such as column, bar, line, pie, and others, by choosing an option from the Insert tab’s Chart group.
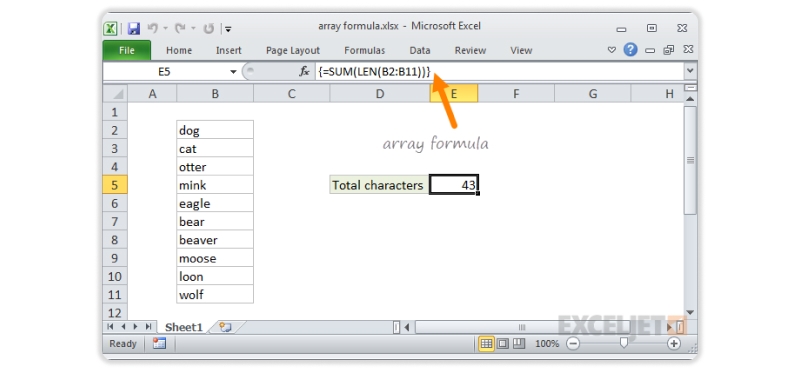
Answer- An array formula in MS Excel is able to process various values rather than a single one. The array formula calculates all the values present in the array and does several operations as per the prerequisites depicted in the given formula.
Answer- Columns can be added in the pivot table by following the below-mentioned steps:
Answer- Slicers of software filters are deployed to filter the information from a huge range of data. This particular characteristic of Excel lets you comprehend the details related to the retrieved data. Slicers refer to one-click software that files data very effectively and rapidly.
Answer- The columns in MS Excel can be rearranged in the following ways:
Q57. What is meant by the red triangle at the top of a cell?
Answer- A red triangle in MS Excel refers to the top-right corner of the cell representing that a certain note is there in the cell. When you rest the mouse cursor on the red triangle, the text contained in the note is visible.
Q58. Mention the steps to use the transpose function.
Answer- The steps to use the transpose function are mentioned below:
Answer- To use the advanced filters in MS Excel, follow the steps given below:
Answer- You can double-click on the cell’s bottom right corner having the formula. If the formula is there in the first cell of the column, then you may follow the steps below:
Answer- Cross tabulation refers to the statistical way utilized for quantitative analysis of the data. This method can be used to summarise huge datasets. The cross-tabulation method supports detection of important information from huge data. It can be used to analyze the connection between various variables.
Answer- Conditional formatting uses multiple kinds of formatting on the cells per certain conditions. It may be used to give a highlight to any duplicate cells or cells having a numeric value below 5. It enables you to highlight cells with a specific color per the value. You can highlight the odd numbers or the even ones according to your requirement.
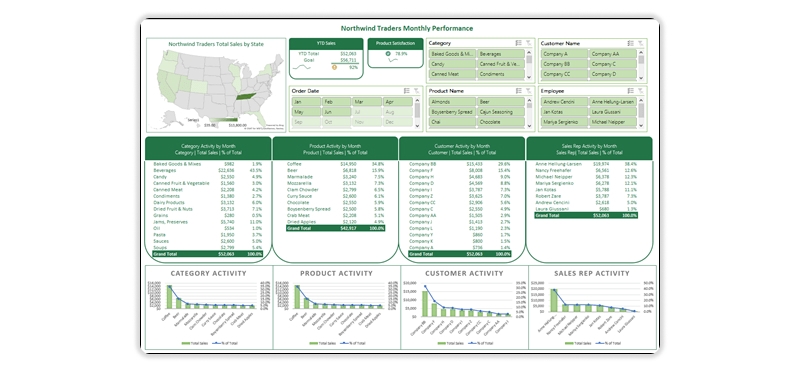
Answer- A dashboard is meant to depict vital data through graphical representation. Dashboards are useful as they show large data on one computer screen. This allows it to be reviewed with just a look, and helpful data can be derived from it. The dashboard uses color-coded gauges to depict if metrics are within intended parameters or if more information is demanded on a certain concept.
Answer- You can use the text-to-column option in the Data tab to split the actual column into various other columns. You can also split by count of the characters or by expanding (searching for a single indicator). A general instance is segregating cell FirstLastName into a First and last Name. By expanding the space, it is possible to segregate an entire array of names into their respective component sections.
Answer- A drop-down list lets the maker of an Excel sheet handle the information entered into specific cells. If the maker just wishes one out of the four certain alternatives to be utilized, rather than depending on disloyal user inputs, they can guarantee that it is adhered to by allowing the users to choose an option from the drop-down list. Worthy inputs are similar to proper outputs, decreasing the chances for manual entry, and thereby facilitating smoother analysis.
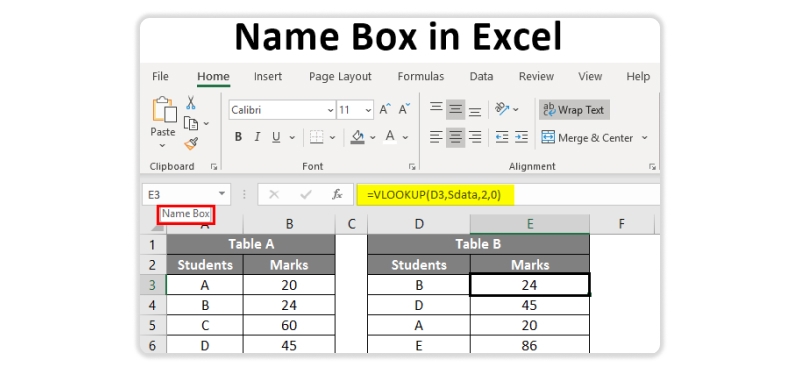
Answer-The Name Box refers to an input box situated over the Excel sheet to the left of the formula bar. The default mode shows the address of the recently chosen cell, however, it also has other utilizations. The Name Box can rapidly choose a certain cell or set of cells. Typing in a cell reference such as G8 will automatically shift to cell G8. Typing in a set of cells like G8:G30 will choose all the cells in that range. The Name box is also sued to make a named range and as a drop-down menu to shift between the name ranges.
Answer- Macro languages for MS Excel are written in Visual Basic for Applications. The VBA can be utilized to write the actions for a macro yourself manually. You can record activities through the Macro Recorder in MS Excel. Then the software will change the VBA code on your behalf. When you get better in VBA, you may review recorded macros and work on the updates to manage the use cases.
Now that you have an overview of the MS Excel interview questions, you easily prepare yourself for the Excel interview questions and answers. Here we have enumerated the top 50 excel interview questions for freshers as well as for experienced candidates. Regular practicing of Excel and preparing yourself through these Excel interview questions will help you to crack your upcoming interview call.
Excel is an intrinsic part of an I.T professional. To kickstart your I.T career, enroll in our professional certification courses that will cover all the concepts from the basic till the advanced levels.
We hope you find this blog useful. For any query, leave a comment and we will get back to you.
JanBask Training team wishes you good luck for your interview.
Q1. How does Excel help in analyzing data?
Ans- MS Excel is one of the most commonly used tools for data analysis. Most data analysts rely on Pivot tables for the statistical data. Excel helps in faster and simpler data analysis and provides high-level visual summaries, trends and patterns.
Q2. Is Excel necessary for Data Science?
Ans- Excel is necessary for data scientists and is considered as a base structure for intelligent data. Excel is a smart way to extract insights from data. The basic data analysis tasks are performed by Excel. Excel is used by beginners as well as by experienced Data Scientists in their workplace.
Q3. How can I learn Data Science?
Ans- You can learn Data Science through our online Data Science certification course that will give you practical learnings from basic to advanced around Data Science methods with R & Python, machine learning, AI, deep learning, Big Data Hadoop, and Tableau Data Visualization in complete depth. Our Data Science certification training lets you master the concepts of Data Science based real-life industry cases increasing your job market value.
Q4. What skills will I learn in a Data Science course?
Ans- In the Data Scientist course, you will learn R programming, Python, machine learning, deep learning, regression analysis, data architecture, visualization techniques, risk analysis, process improvement, systems engineering, and many more concepts that are important for the Data Scientists certifications exam and to be an industry-ready professional.
Q5. What is the objective of the Data Science course?
Ans- To provide a virtually accessible Data Science course that is similar to the offline classroom session and redeems you from the burden of traveling exhaustively - to help you grasp the Data Scientist demande skills/knowledge around R programming, Python, Data mining, machine learning with R, data visualizations, etc. via live coding with mentors and real industry case scenario assignments.
Q6. Is there any difference between Data Science and Data Analytics?
Ans- Data Science is a broad field that deals with extracting meaningful information through algorithms, statistics and scientific methods. It is related to Big Data and is considered to be one of the most in-demand skills. Data Analytics is a branch of Data Science and is used to get conclusions by processing raw data.
Q7. What are the important skills required to become a Data Scientist?
Ans- To pursue & apply the Data Science/Scientist job, you are required to specialize in the following technical skills:
Q8. Which Data Science certifications are in demand?
Ans- The few in-demand Data Science Certifications which you can think of achieving after completing our intensive & real-industry assignments based Data Science training are:
Q9. What can I expect after the certification program?
Ans- After completing our Data science Certification training, you will end up having:
Q10. Do you help with job placements?
Ans- At JanBask Training, with our Data Science training, we keep you exposed to the real-time industry’s job market scenario with available facts & numerical figures. We serve you knowledge on the actual scenarios of the data concentric industries/companies, their peak hiring hours, their hiring pattern, and everything that could support you in achieving those great job opportunities real quick. Along with certification examination preparation, we deliver you smart ways on how you can be a part of the job market with ease.

SQL Server MERGE Statement: Question and Answer
 Jul 11, 2023
  3k
3k

Mastering INSERT and OVER DML Syntax: Interview Questions Guide
Jul 11, 2023 2.5k
SQL CLR Deployment and Error Resolution: Question and Answer
Jul 17, 2023 2.4k
Cyber Security

QA

Salesforce

Business Analyst

MS SQL Server

Data Science

DevOps

Hadoop

Python

Artificial Intelligence

Machine Learning

Tableau
Download Syllabus
Get Complete Course Syllabus
Enroll For Demo Class
It will take less than a minute
Tutorials
Interviews
You must be logged in to post a comment