 Month End Offer : Get 30% OFF + $999 Study Material FREE - SCHEDULE CALL
Month End Offer : Get 30% OFF + $999 Study Material FREE - SCHEDULE CALL
Tableau is a reporting tool that has revolutionized the world of business reporting. Reporting has never been easier before, thanks to Tableau. This is why more and more companies are adopting this fantastic tool to achieve the purposes of a good business report. This adoption of Tableau has created a lot of job openings within companies that require skilled Tableau professionals to fill these vacancies. This has left a lot of scope for Tableau questions to be answered by these aspiring Tableau professionals.
If you aspire for a process in Tableau, you'll face an activity interview for the same. We've compiled a list of the most typically requested tableau interview questions and solutions to assist you with your interview.
The blog also contains Tableau technical interview questions for experienced and intermediate candidates to help them ace the interview. You can start by learning more about tableau by enrolling in a professional tableau online training course to become an expert in this field with the most astonishing suggestions to get certified. Now, let’s move on to know a few Tableau Interview questions and answers that will help you to crack the interview in one go.
Ans:- Tableau is a Business Intelligence tool for visually analyzing data. Users can create and distribute an interactive and shareable dashboard depicting trends, variations, and data density in graphs and charts. Tableau can connect to files and relational and Big Data sources to acquire and process data, allowing data blending and real-time collaboration.
Check out our detailed Tableu tutorial for beginners in the video below:
Ans:- Tableau supports the following data types:
|
Boolean |
True False |
|
Date |
August 5, 2018 |
|
Date & Time |
August 5, 2018, 05:15:00 PM |
|
Geographical Values |
New York |
|
Text / String |
Hello |
|
Decimal Number |
15.356 |
|
Whole Number |
10 |
Note: Left-hand side of the image shows the data types and the right-hand image displays the same examples.
Ans:- Following are the fundamental difference between the traditional BI tools and Tableau
|
Traditional BI tools |
Tableau |
|
The architecture of traditional BI tools has hardware barriers. |
Tableau does not have any sort of dependencies. |
|
Traditional BI tools always work on complex technologies. |
Tableau utilizes a straightforward associative search to construct it dynamically. |
|
The Traditional BI tools do not support multi-thread, in-memory, or multi-core computing. |
Tableau supports all these features |
|
It has a predefined data view |
It does a predictive analysis of business operations. |
Ans:- Sets are custom fields developed as a subset of the data depending on the different conditions.A set displays the comparison between two different values or groups on the same row. For example, a set may include consumers with sales over a specific threshold.
Ans:- Groups are a quick and easy way to organize your data in Tableau. Groups can help you filter, sort, and group your data in many ways. You can create groups by dragging fields from the left-hand side of the screen onto the Grouping shelf. Once you've created groups, you can use them to answer tableau interview questions about your data.
Ans:-Shelves contain various named elements like columns, rows, marks, filters, pages, etc., through which You can add fields on shelves to create visualizations, increase the level of detail, or add context.
Shelves are the same as fields in Tableau. The difference is that fields can be added to shelves or other places in the view. On the other hand, shelves are present at the top and bottom of each view.
Ans:-Parameters are dynamic values that can update consistent values in calculations and filters. Parameters are beneficial for filtering data based on a user selection automatically. When you create a parameter, it looks like a drop-down menu of the values you specify.
The following parameters can accept values:
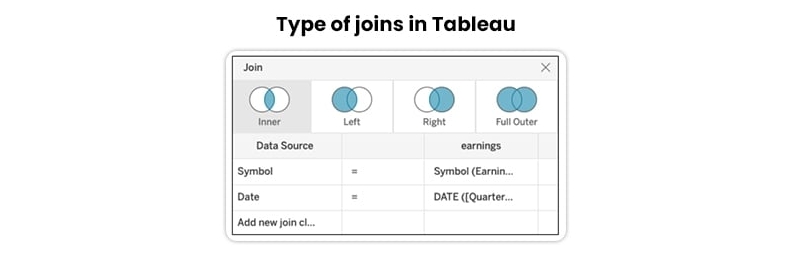
Ans:-When you combine data from multiple tables into a single view, you join the data. Joins let you analyze different data types from different sources in one Tableau view, providing a bigger picture than you’d get from a single dataset or working with individual tables.You can enroll at online classes and get a tableau training certification.
Tableau has four types of joins: Inner Join; Left Join; Right Join; Outer Join.
Ans:- TDE stands for Tableau Desktop Extension, which contains a .tde extension. It refers to a document that consists of facts extracted from outside sources like MS Excel; MS Get entry to, or CSV record. It also refers to a brief snapshot of the information gathered on disk and loaded in the memory as per our requirement to get the Tableau.
Ans:- Following are the five different tableau files available:
Ans:- Tables are also termed as crosstabs that concentrates on distinct values instead of utilizing visual styling. They stand as one of the most used techniques of showcasing data, and hence they are used widely by people to analyze data. Although the concentration is not totally visual since reading values can be a linguistic exercise, however, visual elements can be organized on to tables to transform them into a more potent and easy matrices. You can join up to 32 tables in Tableau.
Ans:- A hierarchical discipline in tableau is used for drilling down information. It means viewing your records to an extra granular degree. Hierarchical fields act identical to standard record fields, the only point of difference being that you have the option to show the field values as hierarchies and you also get the advantage to produce filter conditions at the parent or child stages of the hierarchy.
Ans:- Raw Data can be very problematic. We also can have data in the pattern of a wide rather than a long format. If we wish to transform wide-format data into long-form data, pivoting is beneficial in Tableau. It is the method to shape the data that transforms from a shape of rows to the shape of columns.
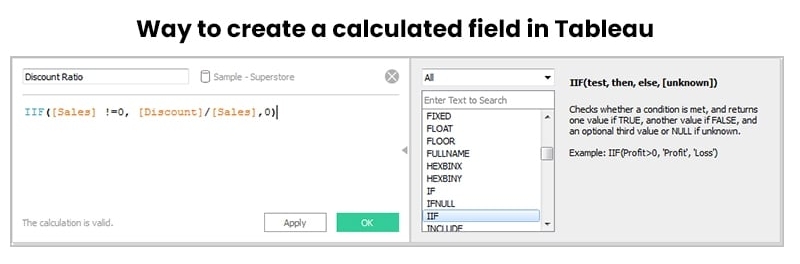
Ans:-To create a calculated filed in Tableau, one must follow the below steps:
For example,
Ans:- Dual axis or Multiple axes in Tableau is an advanced feature. It helps us visualize two or more measures together in a single view. Tableau introduced this feature in version 8, and it has evolved since then.
Many websites like indeed.com and different employ a twin axis to show the contrast among measures and their boom fee in a septic set of years.
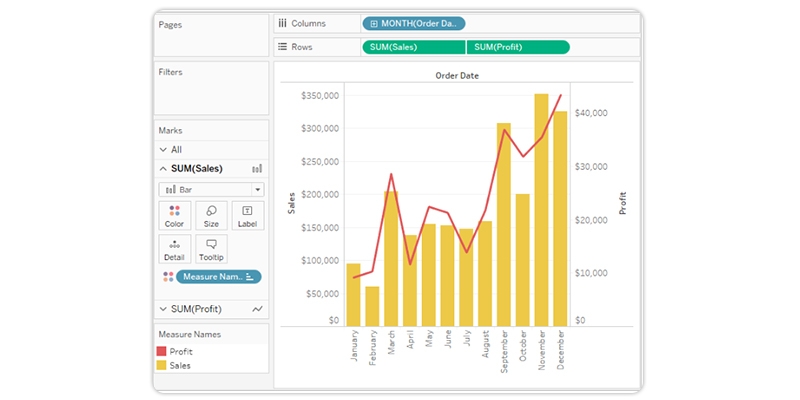
In the above figure, the chart displays two sets of data lying on each other, where the resulting charts will possess a shared axis. On each side, there may be an X-axis for date values (months) and two distinct Y-axis showing different measures, sales, and profit. This helps you compare profit and sales values over time. You can also customize the chart with different mark cards for every axis. Here, a bar chart displays sales figures, and a line chart shows the profit.
Ans:- If statistics is living in a single source, it is usually applicable to apply Joins. While your statistics aren't in one region, mixing is the maximum possible way to create a left join, like the connection between your primary and secondary records resources.
Ans:- A join is executed by creating a single or more join clauses that instructs Tableau the fields that are shared among the tables and how to relate the subsequent rows. The rows with the same ID are moved in the output table. Join clauses utilize the equality operator that connects rows with the identical values..
Yes, we can create relational joins in Tableau without creating a new desk. First, connect to the related data source and drag the initial table to the canvas area. Then choose Open from the menu to open the canvas. Then double-click on the join canvas and tap the join icon to link the join.Try to learn as much as possible for tableau developer interview questions.
Ans:- Story is a sheet that includes a series of worksheets or dashboards that paint together to deliver information. You may create memories to expose how facts are connected, offer context, exhibit how selections relate to outcomes, or surely make a compelling case. Each person sheet in a tale is called a tale point.
Ans:- Connection information is the statistics you must carry into Tableau. Earlier than publishing it, you could create an extract of the equal.
Ans:- Calculated fields are created using formulas based on other fields. These fields no longer exist however are created using you.
There are three principal kinds of calculations that you may create:
Ans:- Basically, Tableau has many ways to create stories. Every story we create can be based on a different view or dashboard, or the whole story may be based totally on the exact visualization, simply seen at specific stages, with unique marks filtered and annotations delivered. You can use stories to make a commercial enterprise case or narrate a series of events.
Ans:- TreeMap is a visualization that organizes records hierarchically and shows them as a fixed of nested rectangles. The dimensions and colorings of rectangles are respective to the values of the facts pointing to the challenge. Parent rectangles might be tiled with their baby factors.
Ans:- A heat map is a graphical illustration of facts that uses the color-coding technique to symbolize particular values of facts. The map will show dark colorations because the marks warm up due to their higher fee. The other name for a heat map is density map. Tableau makes the map by accumulating overlaying marks and colors as per the count of marks.You might want to remember it for Tableau questions for an interview.
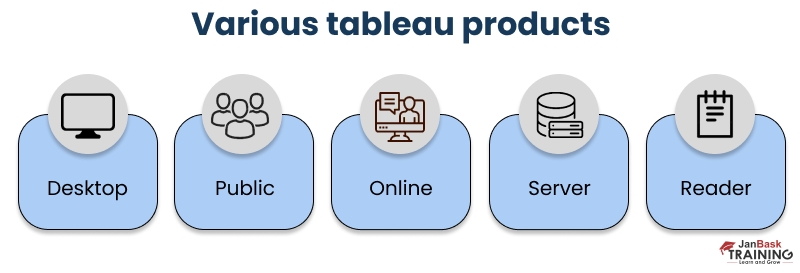
Ans:- Here is a list of a few Tableau Products you should know extensively about and might help you in tableau developer interview questions., as these are the most essential and frequently asked Tableau Interview Questions -
Ans:- The most recent version of Tableau is the Tableau Desktop Version 2021.2.
Tableau 2021.2 introduces the strength of data to everybody over hundreds of organizations so that everyone can place their queries, fetch answers from the data and be ready for any tableau interview questions. New features include experiences for Ask Data and Explain Data, Collections, and a linked Tableau Desktop experience related to web authoring. All these are covered in tableau online training.
Ans:- Tables concentrate on seperate values instead of utilizing visual styling. They are the simplest method to demonstrate the data and analyze it. People communicate through tables on websites in the course of their daily schedule through MS Excel. We visualize tables all over and hence it is vital to understand how to contemplate them and retrieve the maximum information from them
Ans:- Dimensions are those fields that contain data that cannot be aggregated, such as descriptive text columns. Facts are those fields that can be measured, aggregated, or used for mathematical operations, i.e., numerical values. Dimensions comprise qualitative values including names, dates and geographical location. You can utilize dimensions to segregate and expose the information and details. They influence the percentage of detail in the data and are very essential in tableau interview questions.
Facts refer to the informational piece that is quantitative, including a sale.They are gathered in fact tables, and possess an external key connection with numerous dimension tables. Dimensions accompany facts, and define the elements present in the fact table.
Ans:- Heat map represents data as a map or diagram representing data values as colored blobs of various sizes. Heat maps provide an immediate visual summary of information and allow the viewer to understand complex data sets quickly. They visualizes and juxtaposes various segments of data in rectangular blocks. They view measures against dimensions by indicating them in various shades.
Treemaps provide a hierarchical view of your data. In a tableau tree, maps display data in nested rectangles that can legibly display thousands of items on the screen simultaneously. Treemaps are a comparatively simpler data visualization method that offers information in a richer format.
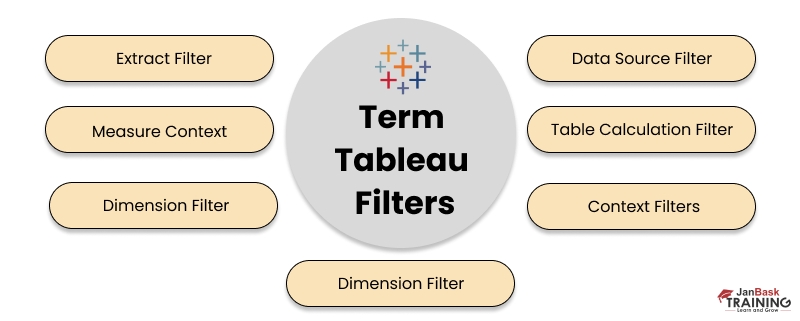
Ans:- Filter allows you to view specific datasets while hiding unneeded data in a Tableau workbook, dashboard, or view. Filters are extremely beneficial to generate dashboards and they aso assist in reducing the length of data sets for effective utilization. They eradicate useless dimension components, clear underlying data, establish data ranges as needed and arranges the data in a proper way.One should definitely keep these in mind while answering and tableau interview questions.
Ans:- There are three types of filters in Tableau. Read about them in detail since you will likely face these interview questions for Tableau.
Ans:- Following are the steps to remove all options from a Tableau auto-filter:
Ans:- The individuals in the same field are clustered together. We can make groups in various procedures involving choosing data in the view or from a lot in the Data pane. When you choose various data points in view, the tooltip will display an option to group. This option can be utilized to make a group or right-click on the field in the Data pane and select Create> Group. Finally, we can choose selected members from the group and tap the group button.
Ans:- With Tableau, it is straightforward to create longitude and latitude. You need to drag and drop countries or any other geographical location into the view, and Tableau will plot the locations. Furthermore, select the data points, right-click, and choose “view data.” The produced longitude and latitude beside the country name will be visible. The data can also be exported from Tableau for a different program.
Ans:- The top or bottom of the data file might contain a description of the content of the file. Tableau can’t identify the data in its present state. After linking to the data file, you must activate the data interpreter in the left panel. It will eradicate the extra rows from the data source in Tableau, keeping the file achieved from the data the same.
Ans:- To publish Tableau reports to the Tableau server, open the workbook you wish to publish. Ensure that you are on a working sheet that will be delivered to the server. You can’t view “Publish Workbook” in the toolbar’s “Server” menu if you are not on a working sheet. On clicking “Publish Workbook,” log in to the Tableau server account and name it on the server as per your preference.This might be an important tableau interview questions you might face. So be prepared.
Ans:- When two data sources have the same references in a column, we can utilize the “assume referential integrity” option. After that, the feature “assume referential integrity” can be used to state the connection between the two data sources and “join” the data sources. Then, drop the second table beside the first to use referential integrity. Then you will be asked to match the column to execute the join, and then you can select the reference column, and Tableau will execute the join according to the reference and kind of join.
Ans:- A developer should be aware of Tableau’s javascript API to link Tableau to the website. It will let the individual analyze and manipulate the Tableau spreadsheet, enjoying the browser's comfort. Tableau embodies a whole list of the functions utilized in the javascript API. A few essential functions are also depicted, displaying the Javascript API method in the tutorial portion. When published on Tableau Server, the dashboards and worksheets are automatically connected to the Javascript API. The developer must just convert the API into HTML format to begin the communication. Learn it from any tableau online course.
Ans:- Following are the difference between Dimensions and Measures:
Ans:- Extracts are the subsets of facts produced from facts assets. Schedules are scheduled refreshes made on extracts after publishing the workbook. This maintains the records 3177227fc5dac36e3e5ae6cd5820dcaa. Schedules are strictly managed with the aid of the updated server.
Ans:- Following are the supported file extensions used in Tableau Desktop are:
Ans:- There are two ways to connect your visualization to a dataset:
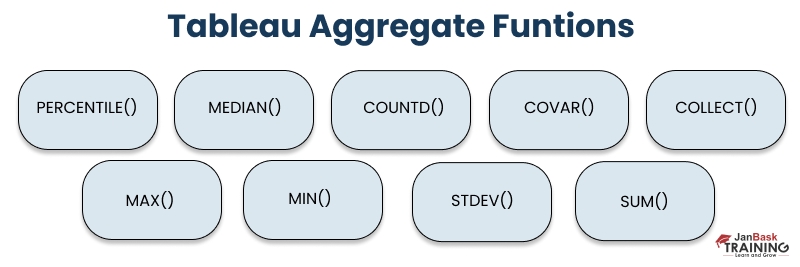
Ans:- Data aggregation and disaggregation are very different processes. Data aggregation is gathering data from a different source and compiling it into a single dataset or database.
The following are the aggregate functions in Tableau:
Data disaggregation, on the other hand, is the process of breaking down a dataset or database into smaller pieces. So when you aggregate data, you combine it to form a new information set. When you disaggregate data, you break the information apart to reveal more detail.You need to be prepared for these data disaggregation facts while preparing tableau questions for interviews.
Ans:- It is the most critical Tableau Developer interview question and comes up in almost every Tableau interview. If you have an introduction to intermediate knowledge of Tableau, you should be able to answer this.
Data Visualization refers to the graphical representation of information and data. Data Visualization uses Statistical graphics, plots, information graphics, and other tools. Numerical data may be encoded using dots, lines, or bars to communicate a quantitative message visually. Patterns, trends, and correlations that might go undetected in text-based data can be exposed and recognized easier with data Visualization software.
Ans:- Tableau helps people see and understand their data. You can work with all kinds of data across disparate data sets (on-premise database, a database, a data warehouse, a cloud application, or Excel files). Tableau lets you create rich visualizations and dashboards from the data in minutes, connecting any data, anytime and anywhere, regardless of its size and complexity or mix of unstructured and structured data. This might be a very basic question but definitely an important one among tableau interview questions.
Ans:- Extracts allow you to work without an active connection to the data source, improving performance and taking advantage of Tableau functionality unavailable or supported in your original data. Especially when working with large data sets, creating and working with extracts can be faster than working with the original data.
Ans:- A .twb file contains Tableau's instructions for interacting with the data sources. It is an XML document that describes the visualizations that Tableau generates. A live connection to the data source is required when working with .twb files. A .twbx file is a Tableau Packaged Workbook containing the original .twb file and data source(s) in one package. When using a .twbx file, analysis can be performed without network/internet connections to yours.
Ans:- Parameters can be utilized in computed fields but filters are not supposed to be fit within expressions. Filters can possess multi-select values but parameters refer to a single select reference catering to user input. Also, actions are present for parameters and not in case of filters. Measures can share a single axis so that all the marks are shown in a single pane called a blended axis. It allows you to compare two or more measure values against the same axis. Drag a new measure onto the existing axis to make a blended axis. You can learn this difference promptly from a tableau online training.
Ans:- The tableau does not support this feature or process. Parameters in Tableau allow the users to include few recent calculations and computed fields. Parameters offer the opportunity to add a missing variable to the overall work and arrange the demands to examine and showcase the data.
Ans:- Parameters can be used with filters, calculated fields, actions, measure swaps, changing views, and auto updates. Parameters faciliate the development and growth that can be obtained with a free area accompanying volume modifications. Enforced convection is simple to be imposed with parameters in Tableau.
Ans:- Custom SQL Queries can be used to pull data in a structured manner. Instead of importing entire tables, we can use SQL queries to obtain only the required columns/rows, increasing performance. Another benefit of the new custom SQL query is that it helps you to extract, exploit, and avail data from connected databases. You can write a normal custom SQL query to union data from tables, remodel fields to execute cross-database joins, reform or lessen the size of the data for evaluation. You might consider this an important part of Tableau interview questions.
Ans:- Importing an image in the dashboard objects pane is possible. You must ensure that you have selected the floating type, not the tiled type, which is the default one. Now drag the image object near the dashboard and choose the logo you saved on the desktop in .png, .jpg, or .jpeg format. Developers can utilize the drop-down menu present on the right side of the image and select “Send to Back” as a background. The user can also enlarge the logo to utilize it as a watermark logo.
Ans:- A scatter plot demonstrates how two or more measures connect, including or excluding dimensions. A minimum of a single measure is required in every row and column to create a scatter plot. Then you may utilize various dimensions to give extra details. This may include giving marks over color or adding information on the card. The scatter plot involves the data points to be sketched in space, and the shapes are related to the values in the measures.
Ans:- Cycle fields in Tableau are highly beneficial as they allow you to experiment and hover between various color combinations in a cycle. The cycle field will work only when a chart represents more than a measure, such as a stacked bar chart showing infinite visualizations. Here cycle fields come into play. To employ the cycle field, go to the toolbar and select the analysis menu. Then, select cycle fields to glance at various methods to showcase the data.
Ans:- This might be common among the tableau interview questions but one should always be prepared for it. Although several methods boost Tableau’s performance, one of the easiest ways is to utilize the “extract” option available on the data source. This happens to be the most suitable method to enhance the performance of Tableau. After creating Tableau dashboards, run the performance recorder from the help option. It will state the sheets that are hindering Tableau’s performance. You must aim at decreasing the marks. Aim at utilizing a lesser number of filters. If you need to filter, utilize the include field rather than the exclude field. Utilize the context filter to handle vast chunks of data and try employing cascade filters to reduce the time consumed to run a query. You can enroll in a tableau online course to learn and perform the best.
Ans:- A Tableau workbook comprises an entire range of sheets, dashboards, and stories created on a Tableau computer or public, saved on the local application, or published on Tableau public. The workbook can be attained for the Tableau public by selecting the link to the website. Local assets, including background pictures and personalized geocoding, can be incorporated into the workbook if they stay at a point that is inaccessible by other Tableau users or the Tableau server.
Ans:- An extra driver may be required to link MongoDB to Tableau. The driver can be retained from https://www.tableau.com/support/drivers, and it can be installed thereby. After being installed, open Tableay and select “Connect”>” Mongodb BI connector.” Then enter the server’s name, user name, and password for the relevant database. Verify the “Require SSL” box on linking to an SSL server and select “Sign in.” The data sources are finally prepared to go.
Ans:- Cascading filters can focus on a single filter and then utilize other filters on a previously filtered data source. Right-click the filter you wish to utilize as the critical filter and ensure it is set to “all values” in the dashboard. Then choose the following filter and select only the valid values to cascade the filters. This will upgrade the dashboard since you have to save the time that otherwise would have been wasted running all filters over the entire data source.
Ans:- A form of reporting includes making dashboards because after designing them to fulfill the client’s expectations, they can be utilized in ppt, pdf, or different file types until they are compatible with the constructed view. These communicative dashboards let the client arrange the filters and parameters to visualize personal charts in various scenarios.
Ans:- Tableau is utilized in data visualization. Hence it performs a tiny amount of pre-processing. The dashboards look contrasting when opened on a screen with an incompatible resolution. The price of Tableau is costly, and they need to provide strategies aligned to meet the requirements of businesses. The people using Tableau for free and posting their activity on Tableau Public may lead to security issues since Tableau Public cannot safeguard uploaded documents.
Ans:- Download and install R on the desktop to connect R with Tableau. Then utilize the command install. Packages to install the package named Reserve. After installing Rserve, this step will be required only while using R from Tableau. However, the following process needs to be executed each time you want to connect R with Tableau. Utilize the command library to position the library into the present work scenario, and then type Reserve in the command window to link R with Tableau. Then, visit Tableau’s help option and select “Manage R connection. “Enter Localhost” as the server name and “6311” as the port. Choose the “Test Connection” option to guarantee everything is perfect, and finally, select “OK” to close the window pane. Make sure to cover this while preparing for tableau interview questions.
Ans:- It’s impossible to hide the dashboard in Tableau; however, if you upload it to a website, you can create a command to display it only when a specific button is tapped. The sheets can be hidden before uploading the dashboard. This will enable people to visualize the dashboard rather than the personal sheets when they open it.
Ans:- Tableau desktop refers to a product created by Tableau that is utilized to create, edit and gather data visualizations restrictedly on the desktop. The server or the public can see the visualizations after completion or during the process. Tableau Desktop users also have the privilege to edit a file created on another system in the same or an inferior version of Tableau.
Ans:- To determine the percentage in Tableau, choose Analyze > Percentages available in the left pane. Many percentage breakdowns are present, including the percentage of the table, row, column, and cell. Select any options and then enter the sum you want to determine the percentage. It is not possible to provide varied alternatives to rows and columns. The choice you select will be identical for every row and column.
Ans:- Bins refer to the containers of equal size required to gather the data values appropriate for the bin's size. Bins break the data into specific groups of identical size, which can be utilized to visualize the data in an organized manner. The discrete fields of Tableau can be considered bins also.
Ans:- Tableau comprises in-built tools for data analysis on a chart. There are multiple tools, including adding an average line to the chart. If you drop the tool over the chart, Tableau performs the calculation. There are numerous tools to experiment with and analyze the data, like clustering, percentages, creating bands of a particular length, and others. Such tools can be seen on each sheet's “Analyze” tab needed to develop a chart. The characteristics displayed when they are deployed on the worksheet.You can always learn about analysis and more in tableau online training.
Ans:- There’s no straightforward process to create a doughnut chart, but Tableau includes two methods to perform the task. To display a donut chart on the sheet, create a pie chart and add an extra measure to the rows shelf. Here two pie charts will be visible on the sheet. Modify the second pie chart’s color to resemble the background and make it smaller. Then, right-click on the second instance in the rows shelf and select “dual axis.” Then, eliminate any extra information. The next method to create a donut chart will be valid only in a dashboard. Make a pie chart in a sheet and transfer it to the dashboard. Now insert a round image in the middle that resembles the background’s color. The below mentioned figure represents a donut chart.
Ans:- KPI is the abbreviation for Key Performance Indicators. Tableau makes it simple to view how well an organization performs depending on some KPI by utilizing the KPI in Shapes Card. To Create a KPI, first, make a calculated section and categorize the values as successful or unsuccessful according to the needed parameter. Then create a chart by a dimension and the section you have made. Convert automatically to shapes in the marks card. Enter success and failure on the KPI shapes to create a smooth comprehension.
Ans:- The charts that must not be used include:
Ans:- Discrete data roles comprise values that contrast with each other. They can consume different values within a range. Discrete values are depicted as blue icons in the data window and as blue pills on shelves. The discrete fields can be appropriately arranged.
On the other hand, continuous data roles comprise any value within the finite or infinite range, such as age, unit price, or order quantity. Continuous values are depicted as green icons in the data window and as green pills on shelves. The continuous fields can’t be organized.
Ans:- The dashboard comprises five elements:
Ans:- The line chart refers to a renowned pictorial manner to view the data. It links the separate data points to visualize the data. The range of values and the ongoing trends can be viewed, and the upcoming values can also be assumed. The horizontal axis signifies the section to which it corresponds, and the vertical one contains the values.
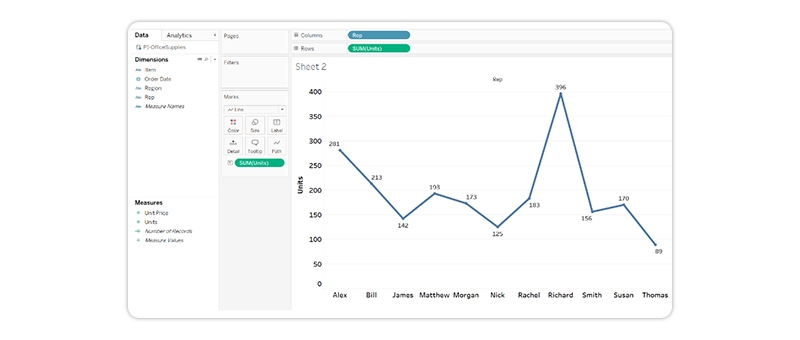
The above figure shows the data indicating the selling of items by the representatives in various places along with the count of products sold with the unit price.
The Tableau will split the dimensions and measures into distinct categories. In the column (x-axis), it indicates “Representatives” and in the rows (y-axis), it displays “Units” that are considered for visualization utility. We must drag the measures and dimensions into columns and rows. We must also choose the “Line” in the “Marks” section, to visualize the graph in the form of a line chart. Learn about Line Charts and other graphs from tableau classes.
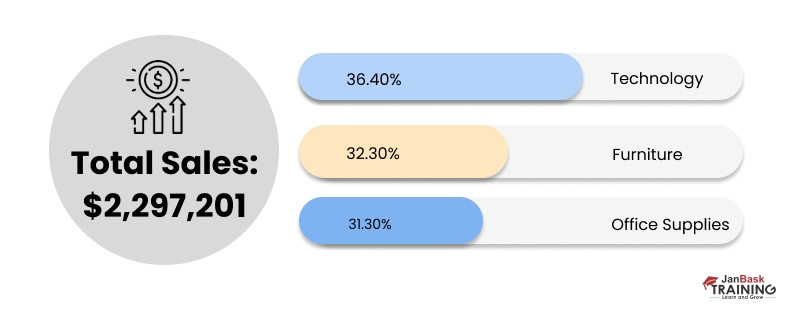
Ans:- Stacked Bar Chart comprises several bars stacked horizontally beneath each other. The value in the data point decides the length of the bar, and a stacked bar chart simplifies the task. They allow us to understand the modifications in all variables displayed simultaneously. The alterations can be viewed in the entire and predicted upcoming values.
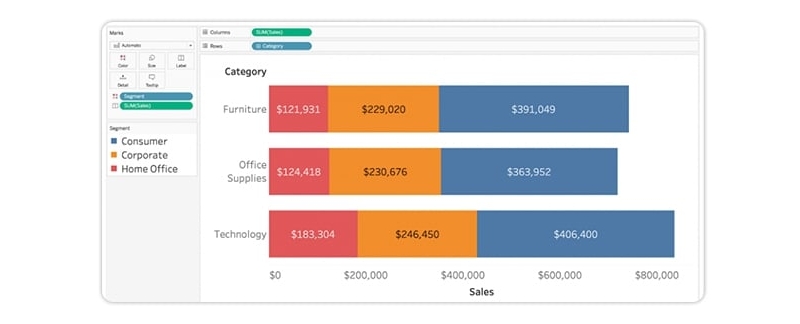
The above image shows a bar chart colored by segment, hence labels are given at the segment part. The individual sales value is visible and we can see that the Technology section sells more in total compared to other sections.
Ans:- Stacked Column Chart consists of various bars stacked vertically, one above the other. The value in the data point denotes the length of the bar. A stacked column chart is the appropriate manner of understanding the modifications in the variables. This chart must be verified when the series count is greater than two.
Ans:- An area chart is a line chart, and the area between the x-axis and lines will signify colors or patterns. Area charts are deployed to display gathered totals in a period, and it is the traditional way to show stacked lines.
Ans:- There are several disadvantages of context filters. On setting a context filter, Tableau produces a temp table that requires it to be refreshed every time when the view begins. Hence, when the context filter is altered in the database, it requires recalculating the temp table, which hinders Tableau's performance.
Ans:- Following are the difference between Tableau and QlikView or IBM:
Ans:- Measures can share a single axis so that all the marks are shown in a single pane called a blended axis. It allows you to compare two or more measure values against the same axis. Drag a new measure onto the existing axis to make a blended axis. Blended axis is utilized when more than to measures work in various lines and charts. Blended axis is also a goof alternative to be used when there is a requirement to depict two measures on one axis.
Ans:- No, the tableau currently does not support this feature or process. The parameters refer to the workbook variables such as an integer, data, or assumed field that let the user substitute a fixed value in a calculation or a field.
Ans:- Parameters can be used with filters, calculated fields, actions, measure swaps, changing views, and auto updates. Parameters are used in Tableau for computing the fields that are utilized in the view. You can depict the parameter control in the view for users to choose the respective parameters. It is also possible to reference them in parameter actions. Filters, bins, calculated fields, and reference lines are the four kinds of parameters available in Tableau.
Ans:- You could embed interactive Tableau perspectives and dashboards into internet pages, blogs, wiki pages, web programs, and intranet portals. Embedded perspectives update as the underlying statistics adjustments or their workbooks is updated on Tableau Server. Embedded views comply with the identical licensing and permission restrictions used on Tableau Server. this is, to peer a Tableau view embedded in an internet page, the character accessing the view must also have an account on Tableau Server.
Rather, if your business enterprise uses a core-primarily based license on Tableau Server, a visitor account is available. This permits human beings for your enterprise to view and interact with Tableau views embedded in internet pages while not having to sign up to the server. touch your server or website administrator to determine if the guest user is enabled for the web page you submit to.
you may do the subsequent to embed views and adjust their default appearance:
Get the embed code provided with a view: the percentage button on the top of each view includes embed code that you could copy and paste into your website. (the share button doesn’t appear in embedded views in case you alternate the showShareOptions parameter to fake inside the code.)
customize the embed code: you can customize the embed code using parameters that manipulate the toolbar, tabs, and more. For greater statistics, see Parameters for Embed Code.
Use the Tableau JavaScript API: net developers can use Tableau JavaScript objects in internet packages. To get admission to the API, documentation, code examples, and the Tableau developer community, see the Tableau Developer Portal.
Ans:- The most variety of rows or columns is indefinite because even though Tableau consists of petabytes of statistics, it intelligently uses the simplest those rows and columns you want to extract for your motive. Tableau shows data utilizing marks, where every mark is related to a row in the data source. The inner fields on the Rows and Columns shelves identify the original mark type.
Ans:- There are various differences between published data sources and embedded data sources in Tableau. In published data source carries connection records independent of any workbook and can be used by more than one workbook. Embedded data sources comprise connection records associated with a workbook.
Ans:- Tableau force is a technique for scaling out self-service analytics. The drive is based totally on pleasant practices from a success enterprise deployments. The methodology relies on iterative, agile methods that might be faster and more powerful than traditional lengthy-cycle deployment. DRIVE is the abbreviation for Define, Review, Identify, Verify and Execute. It is a common and beneficial method to solve issues and analyze them and it is also helpful to escalate process refinement.
Ans:- By including the same calculation to the ‘institution by way of’ clause in sq. question or developing a Calculated subject within the facts Window and using that subject each time, you need to group the fields.
Be a beginner or experienced it's always helpful to know how to use groups in a calculated field to ace interview questions on tableau.
Ans:- Joining a member is a method for combining the related data on not unusual fields from an equal source. The result of mixing information the usage of a be part of is a virtual desk normally extended horizontally by adding facts columns. A join mixes the data and aggregates while a blend first aggregates and then mixes the data.
Ans:- The differences have been mentioned below:
Ans:- Tableau can’t plot the values if the field comprises null values, zeros, or negative integers on a logarithm axis. There’s an indicator in the lower right corner of the view that allows you to select from the following options:
Ans:- A marks card in Tableau helps provide details to the chart since it can offer various colors according to the category and alter the size of a line, circle, or bar in the chart depending on the measured value. Mark's card is also beneficial for entering labels on the chart and provide information regarding the view. It is also helpful to manage the tooltip and how it looks, which must refine the visualizations.
Ans:- Rank Function is beneficial in offering ranks to any measure in the data set. The process to rank measure in Tableau is mentioned below:
Ans:- Tableau Public is a free service allowing anyone to upload communicative data online. On publishing the data to the web, everybody can communicate with the data, download it and develop customized visualizations regarding it. Tableau Public does not need any programming capacities. We can verify the gallery to view a few things people perform utilizing Tableau Public.
Ans:- Tableau is used by everybody on multiple projects. Hence the task starts with comprehending the necessity and fetching the necessary data, making a storyboard, developing visualizations in Tableau, and finally showing it to the client for approval.
Ans:- Yes, we can store huge chunks of data in a memory engine through Tableau. However, one can gather a huge amount of data depending on the various configurations of Tableau server usage, including 8 cores, 16 cores, and others. Factors including server memory also influence how much data can be gathered. When storing huge chunks of data on the Tableau server, we need to ensure that the data volume must not hamper the dashboards’ performance, the response period, and the processing period for extracts. This is the place where Hyper boosts Tableau’s speed.
Ans:- Palantir and Tableau are quite dissimilar. Palantir originates from huge data computer science issues involving security, payments, fraud analysis, etc. The buyers are Paypal, CIA, and others.
Tableau, on the other hand, refers to a visualization player originating from Stanford University Research. Tableau’s Visual Query Language lets the users create visualizations over the standard data warehouses and spreadsheets. Once you take tableau online training you will ace the interview questions on tableau.
Ans:- Making a pie chart needs a minimum of one measure and a single dimension in a row and shelf column. After that, you can choose a pie chart from the show me option on the right side or from the marks card; you can modify automatic into a pie. Then provide a detailing to the pie chart utilizing the dimension in color and measure in angle. The choice to raise the size is available under the marks card. Tap the size option and then move the slider to the right to enlarge the size.
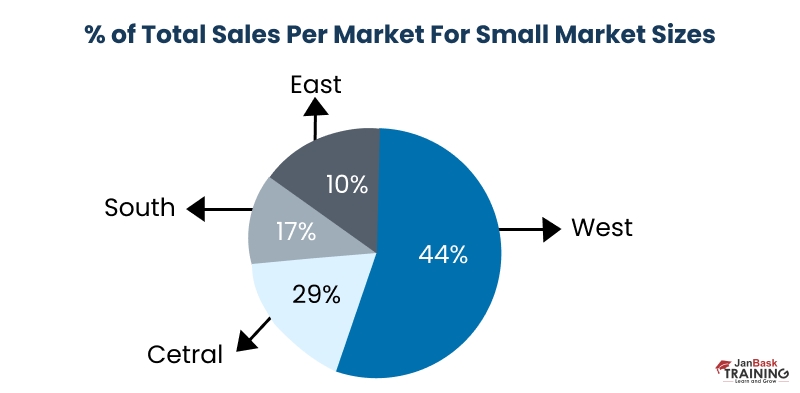
The above pie chart displays the percentage of entire sales per regional market. Only five slices are used here. The top o the circle displays the largest slice. The slices are layered with vivid and vibrant colors.
Ans:- For sure. It gives you facts and a perception of the quantity that other tools can’t. Furthermore, it also helps you to plan and point out the anomalies and improvise your technique for the betterment of your organization.
Ans:- Yes, Tableau desktop can be hooked up on each Mac and home Windows operating device. The steps to install Tableau on MacOS involves the following steps: Open the Disk image file and double-tap the installer package to begin the installation process. Few data sources drivers are automatically installed for hassle-free unification with various data sources.
Ans:- A Tableau Data Server is a secure, centrally managed, and standardized repository for your dataset. It allows you to upload and share data extracts, preserve database connections, reuse calculations and field metadata, and serve as a facilitator between Tableau users and the data. Making it easy for any changes you make to the data set, calculated fields, parameters, aliases, or definitions, to be saved and shared with others. It also increases performance by using the server’s resources to run queries on extracts without first transferring them to your local machine.
Ans:- Tableau Data Engine is an analytical database designed to achieve instant query response. It provides predictive performance and integrates seamlessly into existing data infrastructures. Tableau Data Engine is not limited to loading entire data sets into memory. Data blending is a method for combining data that supplements a table of data from one data source with columns of data from another data source.
Ans:- Tableau performance testing can be done using TabJolt, a “point-and-run” load and performance testing tool specifically designed to work easily with Tableau Server 9.0 or later. TabJolt can automatically load and interact with Tableau visualizations published on Tableau Server. All you need to do is configure TabJolt and point it to the correct server instance and workload. TabJolt simulates virtual users based on your configuration settings and measures various metrics. It records those metrics in a Postgres database where you can maintain a history of your tests.
Ans:- Follow the given steps to add a custom color to Tableau-
In the Preferences. tps file, between the "preferences" tags, paste the following
#eb912b #7099a5 #c71f34 #1d437d #e8762b #5b6591 #59879b
Save the Preferences. tps file and then restart Tableau Desktop.
Open a data source.
Drag a discrete dimension, such as Region, from the Dimensions pane to Color. Click the color.
legend menu arrow and select Edit Colors.
In the Edit Colors dialog box, from the palette drop-down list, select your new custom palette.
Click the Assign Palette button to assign the custom colors to each respective field. Click OK.
Ans:- When publishing reports to Tableau Server, select the option to schedule reports. The report will be refreshed and automatically generated per the selected schedule/interval. There can be different kinds of reports in Tableau in the form of tables, spreadsheets, and others. Visual display of reports can take the form of charts, or graphs. Similarly, reports can be personalized dashboards that are accessible through a browser.
Ans:- The tableau online course has several benefits, like
Ans:- The tableau online training prepares you to chase multiple career paths, including Tableau Consultant, Business Intelligence Manager, Data visualization developer, tableau business analyst, data visualization designer, tableau developer, and Tableau Data Analyst. Hence, the tableau online course is necessary to master the art and become an expert in the field.
Ans:- Tableau is known to be a comparatively easy way to analyze data, and it is a simple visualization tool that anybody with sufficient knowledge and time can use. It takes two to six months for anybody to learn Tableau on an average basis, and this method can consume a long period if you wish to be proficient in learning Tableau’s uses. You can also learn tableau online at https://www.janbasktraining.com/blog/tableau-tutorial/, which provides a tableau tutorial guide for beginners, letting them gain mastery in this field.
Ans:- The tableau interview questions and answers for experienced candidates are beneficial because the list of questions and answers helps the person gain sufficient knowledge of what questions can probably come in the interview and prepare accordingly. The tableau interview questions for data analyst comprises all such questions that will enable the data analyst to ace the interview and get a relevant job in this domain.
Ans:- An individual with sound knowledge and insight about Tableau can grab various roles, such as data analyst, business analyst, and Tableau consultant. Also, in Business Intelligence, you can attain a job as a business intelligence analyst, business intelligence developer, and business intelligence manager, which will let you grab a high salary.
We hope our list of tableau interview questions and answers helped you in preparing for your much awaited tableau developer interview.
If you wish to master tableau developer tools, or any tableau techniques, JanBask Training has curated a list of tableau courses which covers various concepts of tableau developer tools and techniques in depth. This certification course comes with round the clock support to guide you throughout your learning process. Ace any interview with tableau online training and get a tableau training certification.
Sign up for our specially designed Tableau course to improve your skills even more!

Cyber Security

Data Science

QA

Salesforce Service Cloud

AWS
Download Syllabus
Get Complete Course Syllabus
Enroll For Demo Class
It will take less than a minute
Tutorials
Interviews
You must be logged in to post a comment


