
 Aug 25, 2019
  8.5k
8.5k

25
JulMonth End Offerl : Get 30% OFF + $999 Study Material FREE - SCHEDULE CALL
- SQL Server Blogs -
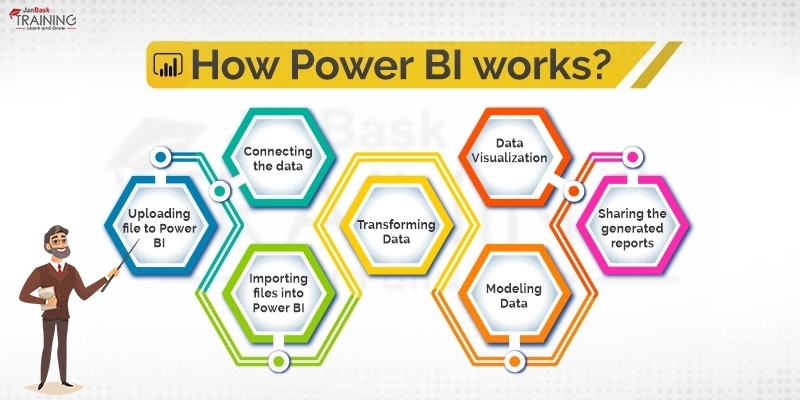
Microsoft Power BI tutorial Microsoft Power BI is a new way to transform the company’s data into rich visuals to collect and organize them in a better manner. The tutorial will help you understand and create Power BI reports and dashboards for both team members and customers.
Who is this for?
Before diving deep into Microsoft PowerBI tutorial, it is preferable to have some fundamental knowledge of Business Intelligence. Business Intelligence (BI) is a collection of methods and tools that are used to analyze raw data accumulated in various organizations. It refers to the strategies and methods used by a company for performing data analysis of any business information. The BI follows the ETL process; E- Extraction, T- Transformation, and L- Loading data into the database which also involves the process of data mining, online analytical processing, and business reporting. Organizations use a BI tool to improve the performance and operations of the company efficiently.
Read: SSRS Pie Chart - Having a Slice of the Pie
Power BI is a data analytics tool developed by Microsoft that turns your bits of unstructured data into a visually compelling story. It consists of Power BI Desktop, SaaS Power BI Service, and a range of mobile apps (iOS and Android). These tools take help from Big Data to analyze data. Power BI takes information from disparate data sources and turns them into customized visually designed sources to help an organization to not only read the information but get a clear idea of what to do.
The Power BI tool uses real-time dashboards to sort through and present data from multiple sources, giving businesses a better way to handle their customers, operations, and future.
Read: Introduction to Stored Procedures and its benefits
The proficiency in Microsoft PowerBI allows you not just to collect the numbers, but to create real value for a business. Whether it’s a simple spreadsheet or a complicated collection of on-premises data and cloud data, Power BI sort it out easily.
The Power BI prepares data engineers and managers with the skills they needed to access Big Data and scrub it for insight. These business users are better equipped to make industrial decisions.
Learn SQL Server in the Easiest Way

Following are the primary reasons for using Power BI tool:-
Read: Difference Between Clustered and Non-Clustered Index in the SQL
| Term | Description |
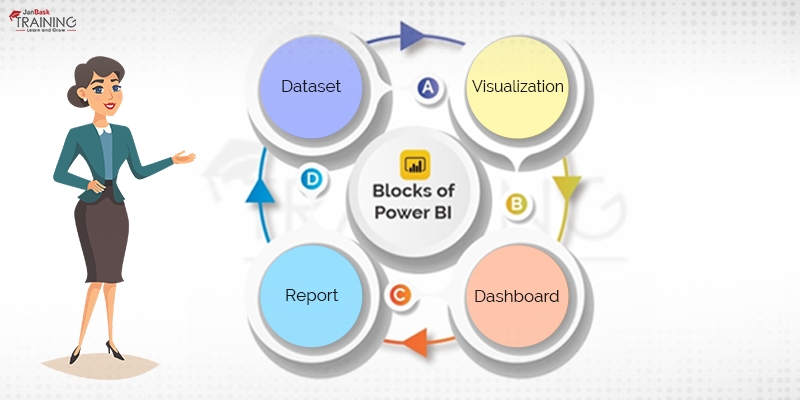
| Visualization | A visual display of information to achieve one or more objective. It offers a single-screen display of information. It alerts users on issues or problems Operational, Performance, Personal, etc. |
| Datasets | A dataset is something which you import or connect to. Datasets can be renamed, refreshed, removes, and explored. |
| Dashboard | The dashboard is a collection which contains zero or more tiles and widgets. It is used to represent a customized view of some subset of the underlying datasets. |
| Reports | A Power BI report is one or multiple pages of visualizations. It can be created from scratch, imported to a dashboard, and created using datasets. |
| Tile | It a single visualization found in a report or on a rectangular dashboard box which contains each visual. |
| Data source | Description |
| Excel (.xlsx, xlxm) | A workbook can have data entered manually or data, which is queried and loaded from external data sources. |
| Comma Separated Value (.csv) | Files are simple text files with rows of data. Every row can contain one or more values, which is separated by a comma. |
| Power BI Desktop (.pbi) | You can use Power BI Desktop to query and load data from external data sources. |
| Databases in the Cloud | It allows you to connect live to Azure SQL Database, Azure SQL Data Warehouse, etc. |
| Databases on-premises | You can connect directly to SQL Server Analysis Services Relational model databases. A Power BI Enterprise Gateway is required. |
Read: What is SQL Delete Query? How to Delete Duplicate (Records, Rows, Tables)
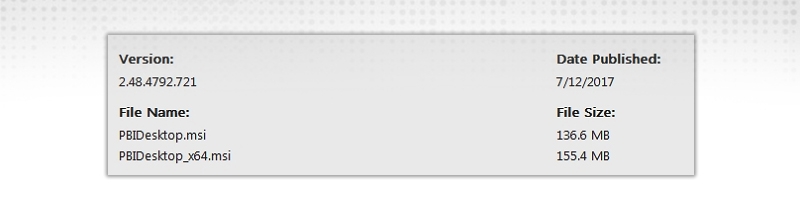
In this Microsoft Power BI tutorial, let us now proceed further for the installation of it! To check the system requirements, installation files detail, users have to navigate to “Advanced download options.” Following are the system requirements to download Power BI tool ?
Supported Operating Systems
Users can select a language in which they want to install Power BI, and the following files are available for download.
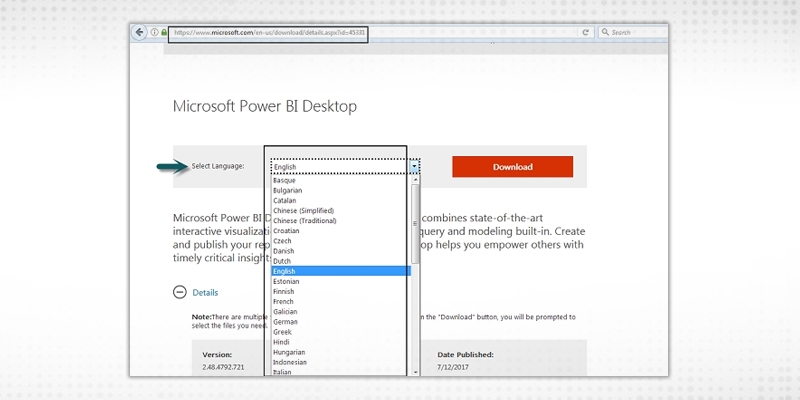
This is the link to directly download Power BI files ?
https://www.microsoft.com/en-us/download/details.aspx?id=45331
Read: What Is The Difference Between Tables And Views In SQL?
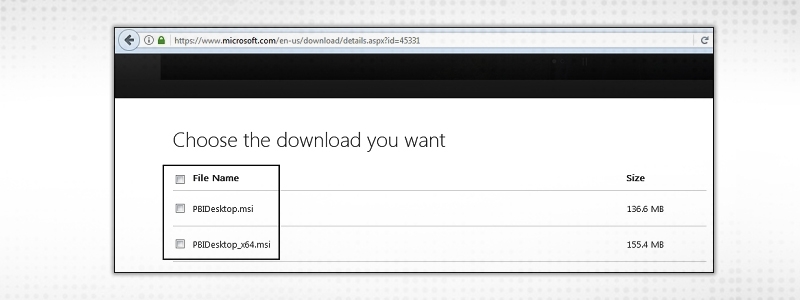
PBIDesktop_x64.msi shows a 64-bit OS file. Select the file you want to install as per OS type and click Next. Save the installation file on the local drive.
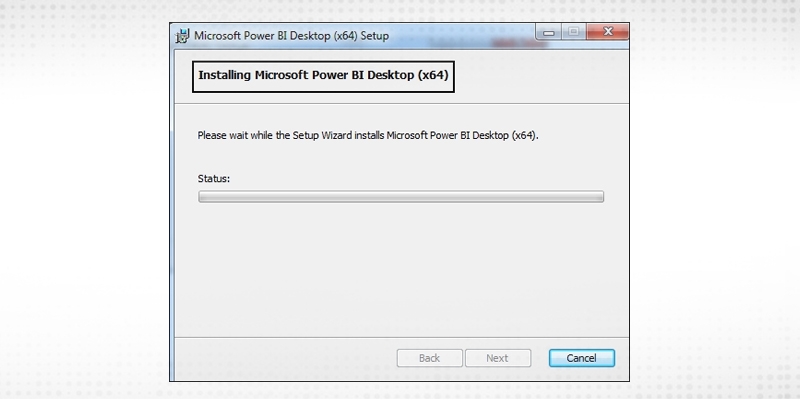
 When you run the installation file, the following screen is displayed.
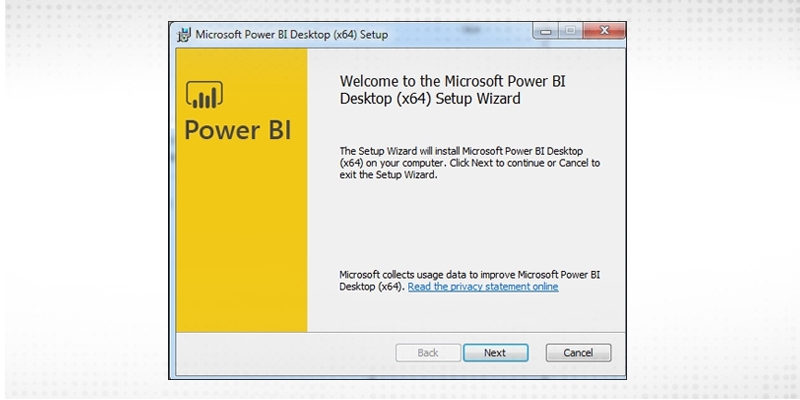 Accept the license agreement and follow the instructions on the screen to finish the installation.
Read: How to Use Alter, Drop, Rename, Aggregate Function in SQL Server?
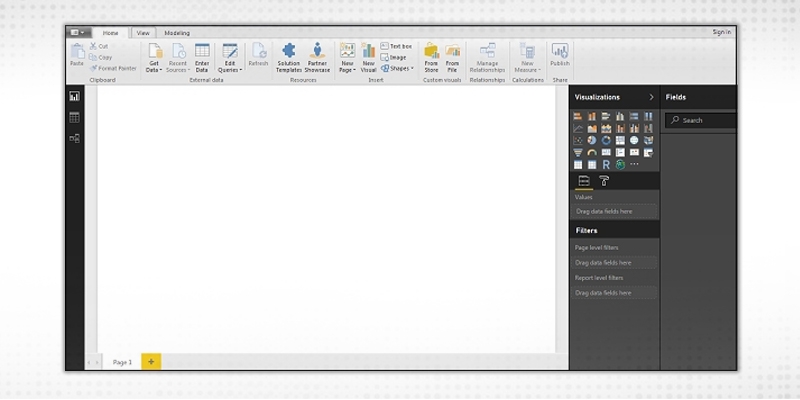
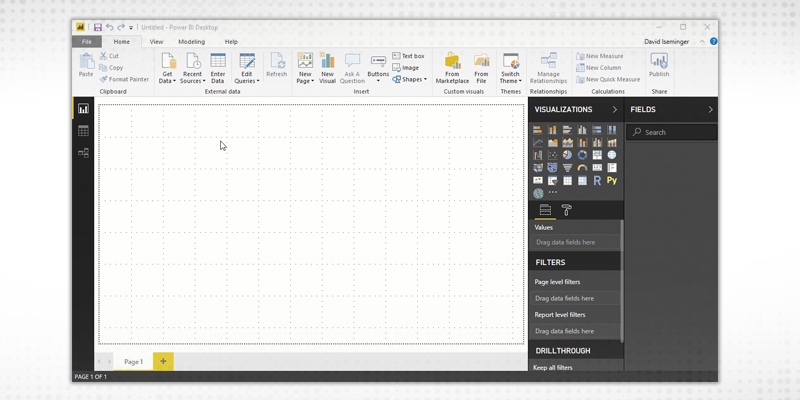
When Power BI is installed, it launches a welcome screen. This screen is used to launch different options related to getting data, enrich the existing data models, create reports as well as publish and share reports.
Request for a demo class to master all required SQL skills.
SQL Server Training & Certification

Let us now get an idea about working with Power BI Desktop. In this section, we shall explore it a bit to get accustomed to its interface.
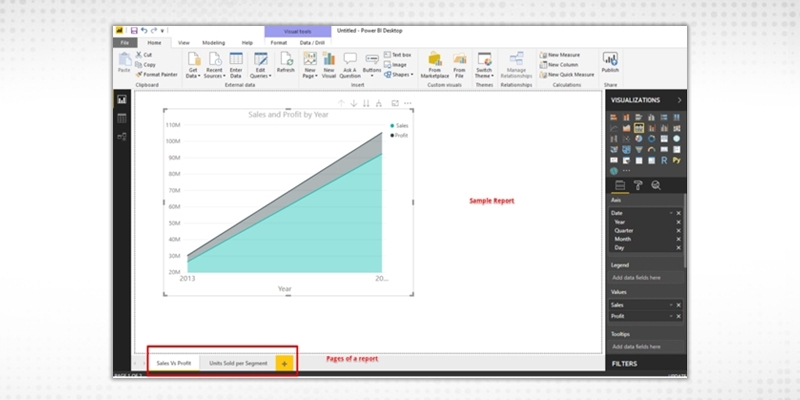
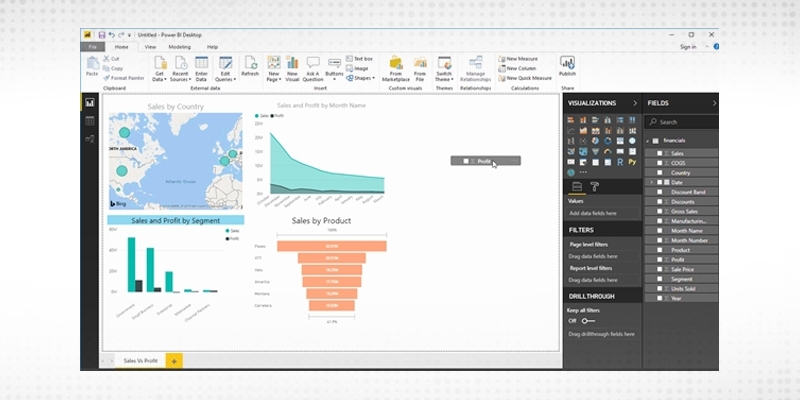
Power BI Workspace
The image below highlights the major components of the workspace of Power BI.
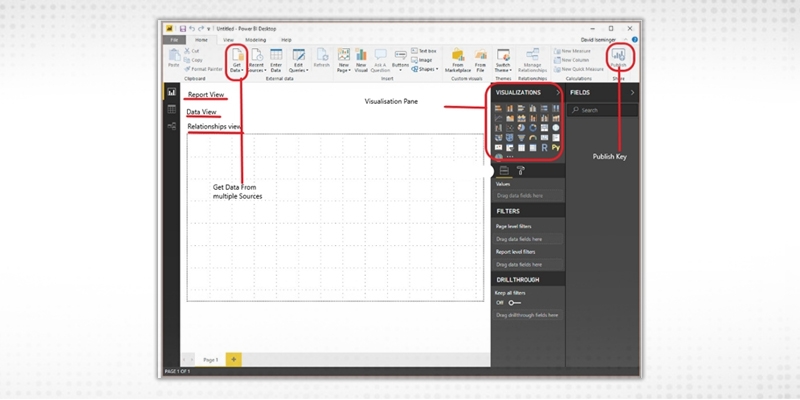
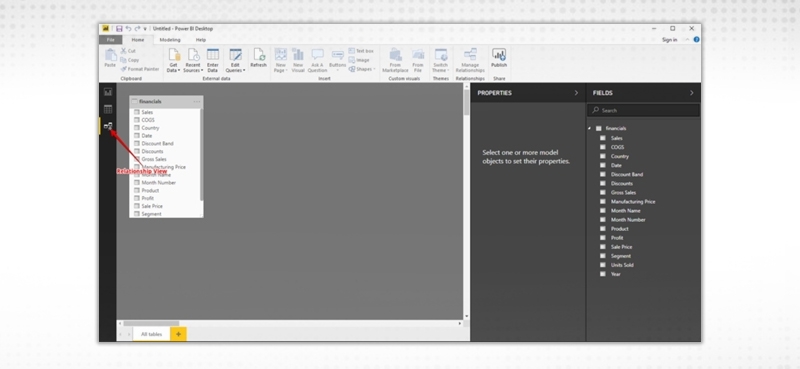
Power BI can be connected to several data sources. The Get Data icon displays all the possible available options from where data can be imported into Power BI.
Read: SSIS Tutorial for Beginners
Let’s look at a few of the most commonly used data sources:
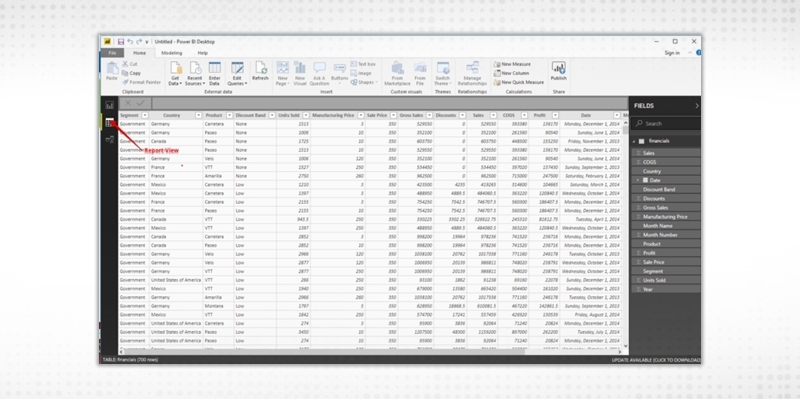
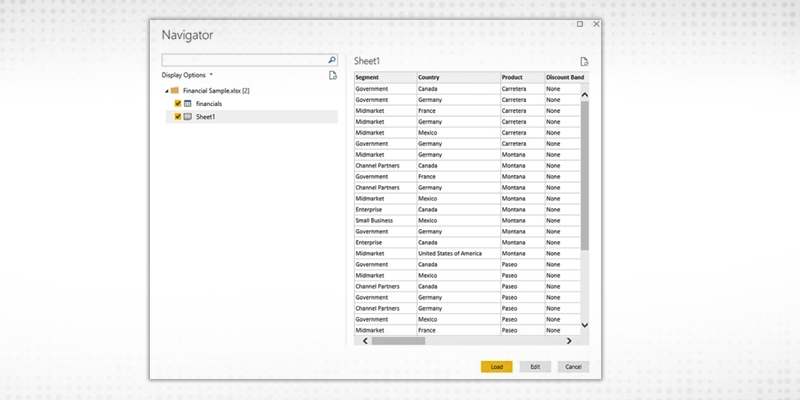
Excel data
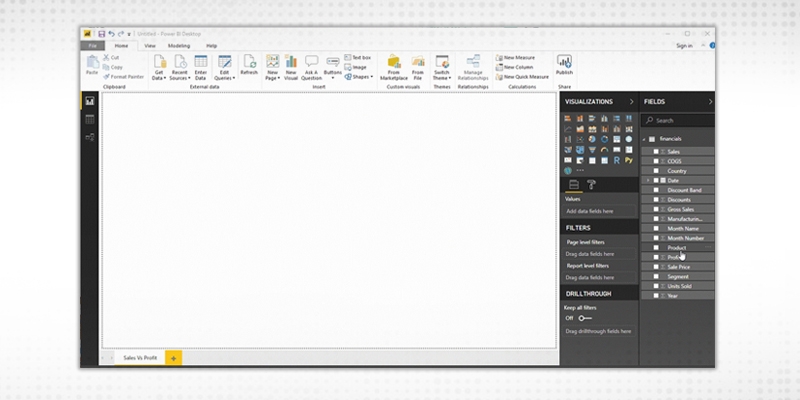
Let’s connect to an Excel data source. The workbooks consist of some fake financial data. Power BI Desktop loads the workbook and reads its contents, and shows you the data in the file using the Navigator window.
Read: Different Types of SQL Server & SQL Database Functions
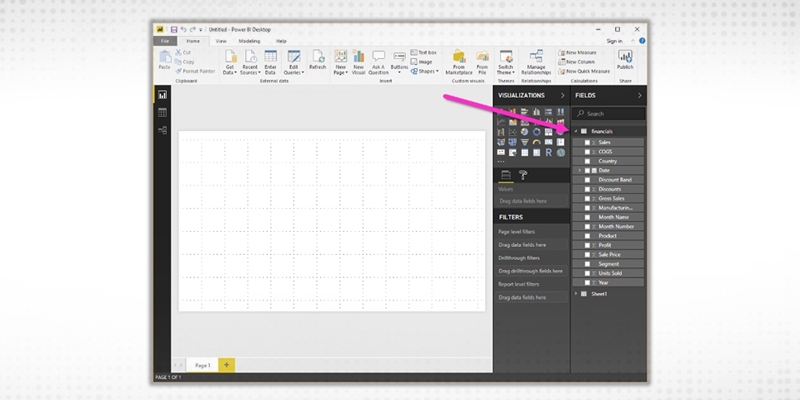
Once loaded, the data can be viewed in the Fields pane.
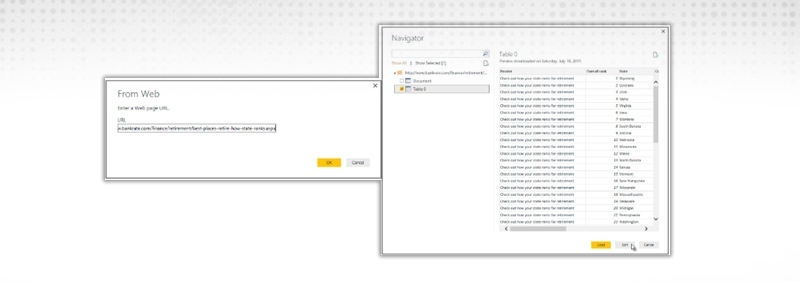
Web
You can also use the data from the web. Here is a dataset that presents the best and the worst states for retirement in the U.S.
Simply select Web as an option in Get Data and enter the name of the URL.
Try experimenting with other data sources too.
Read: SSIS Tutorial for Beginners
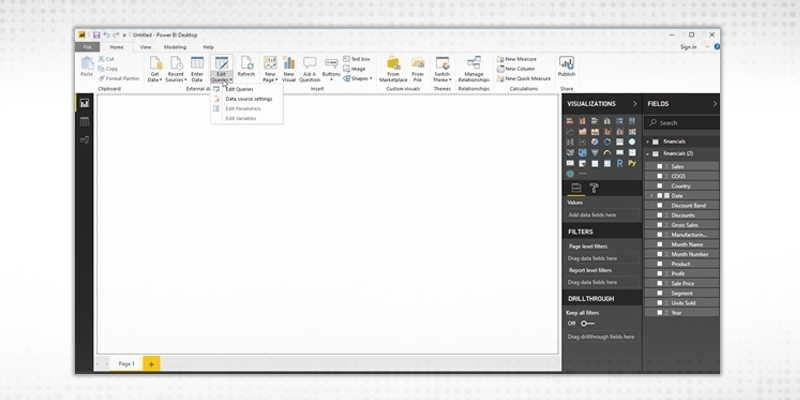
After the data has been loaded, it becomes visible under the Fields Tab. From here, we can modify our datasets with the help of Query Editor. Query editor can be used for modifying datasets irrespective of their data source. We can do manipulations like renaming a dataset, removing a single or multiple columns, etc. in the query editor. The Query Editor can be accessed by clicking the Edit Queries button on the Home Ribbon.
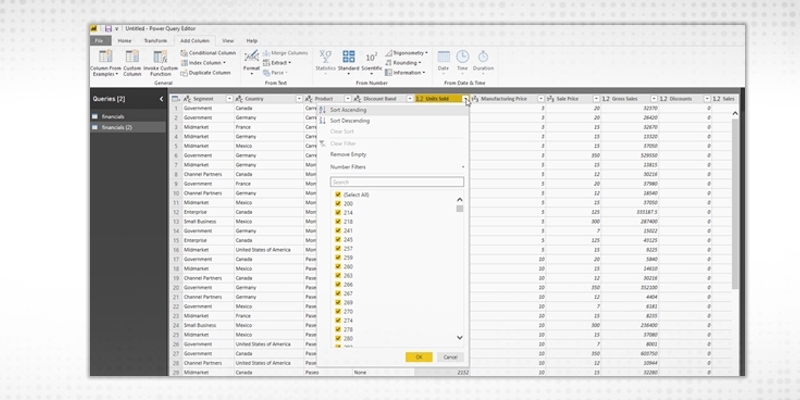
Using the same Financial data, that we used above, let’s shape data to meet our needs. Let’s create a custom column called New Manufacturing Price, which is equal to ([manufacturing Price])*3
The data types of the columns can also be changed easily. The Units Sold column has a floating-point data type that can be adjusted to a whole number.
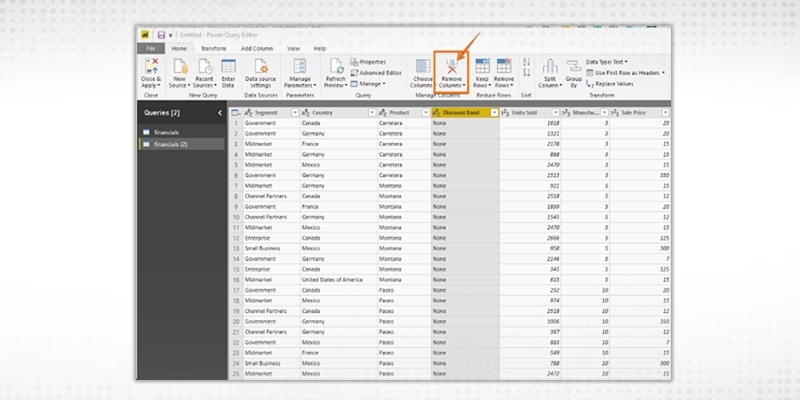
Removing columns is also easy. Simply select the column to be selected and choose the Remove Columns option, as shown in the following figure. Let’s get rid of the Discountcolumn as it is adding no value to our dataset.
Read: Top 50 DB2 Interview Questions and Answers for Freshers & Experienced
Similarly, there are other multitudes of functions that can be carried out like removing and adding rows, transpose, pivot and split, which can be easily achieved through the query editor. Note that all the steps that you undertake to transform your data also appears in the Query Settings panel.
Reports are a collection of visualizations that can be created on one or more pages. These visualizations are usually related to one another.
A dashboard is a collection of several views, enabling one to compare a variety of data simultaneously. Whereas the report can encompass various pages, a Dashboard is a single-page interface.
Creating a Dashboard
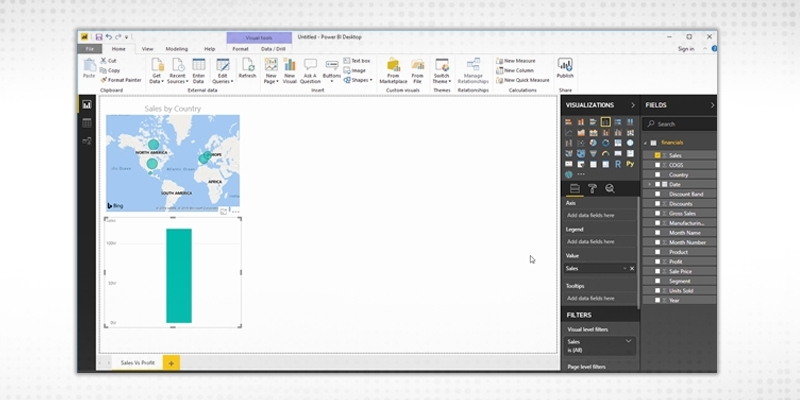
Once we have the dataset ready with all the manipulations done, we can proceed for the Dashboard creation process. A Power BI dashboard, also known as canvas, consists of many visualizations on a single page which helps to tell a story. These visualizations called tiles are pinned to the dashboard from the reports.
Read: What is Foreign Key in SQL? How to Set, Add, Create & Use of Foreign Key
Let’s now try to understand what insights we can get using superstore data set:-
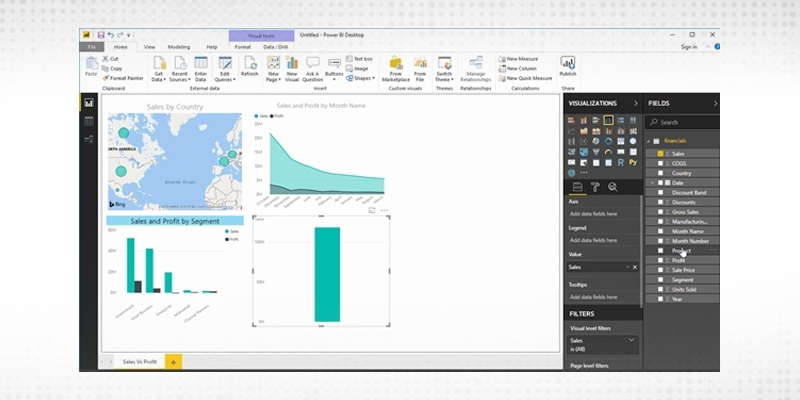
 The Dashboard created is interactive which means a change in one tile affects the other.
Read: All you Need to Know About SQL Database Administrator Salary
DAX stands for Data Analysis Expressions, that is, such expressions that are used for data analysis and calculations. These expressions are a collection and combination of functions, operators, and constants that are evaluated as one formula to get the result. In the case of Power BI, DAX formulas are very useful as they help data analysts to use the data sets at the fullest potential.
In other words, DAX-
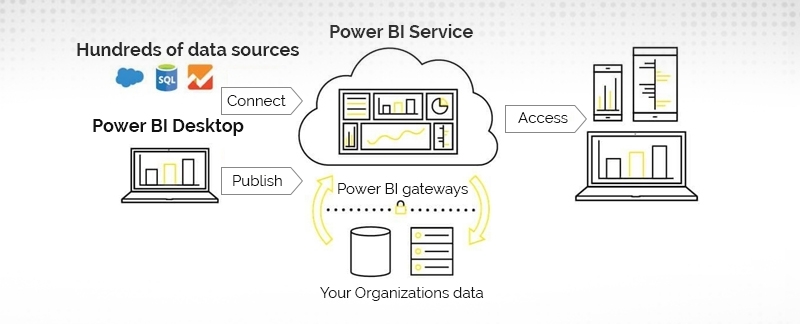
Database as a part of System Architecture
The overall architecture of Power BI consists of three major components:-
Sign up for SQL training classes online and learn how to advance your career as a DBA expert.
SQL Server Training & Certification

The Power BI supports the following building blocks:-
How to increase the speed of Query execution?
Power BI offers a wide range of potential careers incorporating data scientists, product managers, and business analysts. And this Microsoft Power BI tutorial must have helped you in attaining the information of the tool. You can even test your knowledge with Power BI online tests. With a deeper understanding of the power of query, the role played by data warehouses, and everything from Microsoft flow of self-service analytics makes knowledgeable users valuable resources for a variety of organizations. Data analysts make use of the robust platform to discover primary insights that can modify the course of the businesses for the better.
With more experimentation and practice, Power BI becomes a lot more familiar and will unleash amazing features to help the data analysts to present their data. Happy Learning!
Read: SQL REPLACE() Function: A Step-By-Step Guide
 FaceBook
 Twitter
 LinkedIn
 Pinterest
 Email
Email
The JanBask Training Team includes certified professionals and expert writers dedicated to helping learners navigate their career journeys in QA, Cybersecurity, Salesforce, and more. Each article is carefully researched and reviewed to ensure quality and relevance.


Gen AI

Agentic AI

AI in Automation Testing

Cyber Security

Data Science

QA

Salesforce Service Cloud

AWS
Search Posts
Related Posts
Receive Latest Materials and Offers on SQL Server Course
Interviews


 Oct 04, 2024
 6k
6k

 6k
6k