 Sep 21, 2022
  6.7k
6.7k

19
JunMonth End Offerl : Get 30% OFF + $999 Study Material FREE - SCHEDULE CALL
It has become difficult for organizations to survive and grow in today’s competitive market. For key decision-making and almost every critical process organizations have to understand the state of the recent market by analyzing big datasets in real-time.
Power BI and Tableau are two necessary Business Intelligence (BI) technologies which are used for the collection, analysis, and presentation of business information. They also help you perform data analysis, data manipulation, and data visualization to make sense of your business data and draw insights.
The article includes detailed insight on Power BI vs Tableau. Power BI is a business analytics service offered by Microsoft that can analyze and visualize data, extract insights, and share it across multiple departments within your firm. While Tableau is a powerful Business Intelligence tool. It manages the data flow and turns data into actionable insights. Also, it can create multiple ranges of visualizations to present the data and showcase the insights interactively.
Tableau certification path and Power BI certification help you learn new and exciting things. Before we jump onto the Difference between Power BI and Tableau, here are few things to know about Power BI and Tableau.
As per the history of Power Bi and Tableau, Power BI has an easy drag and drop to function efficiently. It also has multiple creative features that allow you to copy all the formatting across similar visualizations.
Power BI was usually designed by Ron George in the summer of 2010 and the initial release was available for public download on 11 July 2011. Moreover, the critical components of Power BI are Desktop, Power BI Service, Power BI gateway, and report server.
Tableau has the feature of drag-n-drop, which allows its user to create interactive visuals quickly. It can also build interactive dashboards with just a few clicks. Tableau Software was founded in the year 2003 in Mountain View, and Tableau Desktop 1.0 was released in the year 2004.
Now, let’s jump onto the main topic, which is the difference between Microsoft Power BI and Tableau that will help you overcome some of the challenges.
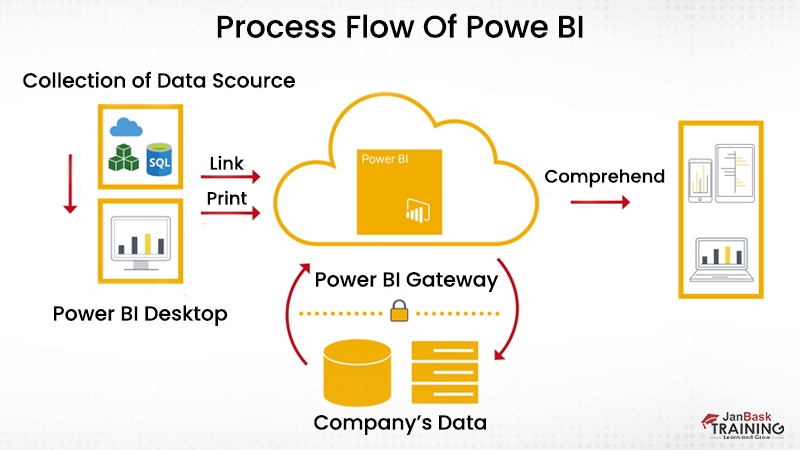
Power BI is a business intelligence and data visualization tool which helps you to convert data from multiple data sources into interactive dashboards and BI reports. It also provides multiple software connectors and services.
Microsoft Power BI is a business intelligence tool that helps you to handle data from various sources. It provides visualization after the cleaning and integration process. It also offers a feature of Adhoc report generation, which helps in data analysis.
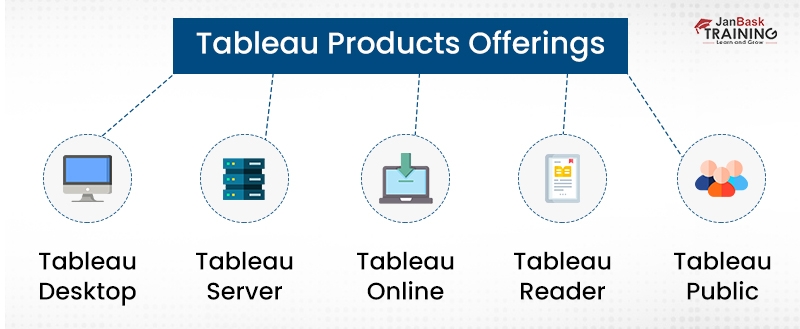
Tableau is a powerful and the fastest growing data visualization tool which is used in the business intelligence industry. Also, it allows you to simplify raw data into a very easily comprehensive format.
Data Analysis is very necessary with Tableau, and the visualizations created are in the form of dashboards and worksheets. This helps professionals to understand the data that is created using Tableau at any level in a firm.
Tableau Online Training & Certification

|
Power BI |
Tableau |
|
|
Meaning |
Power BI is the business data analytics tool which helps you to analyze the business and derive insights from it. |
Tableau is known as a business intelligence and data analytics tool, which is used for generating reports and data visualization with high flexibility. |
|
Features |
Here, are essential features of Power BI such as Customizable dashboards, Datasets Reports, Navigation pane, Q&A question box, Help & feedback buttons, Ad Hoc reporting and analysis, Online Analytical Processing (OLAP), Trend indicators, Interactive reports authoring, Complete reporting & data visualization tools, Real-time dashboards, Offers Power BI embedded, azure service that allows applications to interact with Power BI, Question & Answer feature of Power BI allows users to ask questions using natural language to get some answers in a specific graphical form. |
Here are important features of Tableau such as Data blending, no need of technical knowledge, real-time analysis, Data collaboration and data notifications, DAX analysis function, Patented technology from Stanford university, drag-and-drop, List of native data connectors, Highlight and filter data, Share dashboards, Embed dashboards within, Mobile-ready dashboards, Tableau reader for data viewing, Dashboard commenting, Create “no-code” data queries, Translate queries to visualizations and Import all ranges and sizes of data. |
|
Data sources |
Power BI is that it supports huge data sources but has limited access to other databases and servers unlike other tools. For example Microsoft Excel, Text/CSV, Folders, MS SQL Server, Access DB, Oracle Database, IBM DB2, MySQL database, PostgreSQL database, etc. |
It has access to multiple database sources and servers. For Example: Excel,Text File,Access,JSON File ,PDF File ,Spatial File ,Statistical File ,Other Files (such as Tableau .hyper, .tds, .twbx) etc. |
|
Data capacity |
Each workspace could handle up to 10 GB of Data. And to do so the Data needs to be in a cloud (Azure). If it is in local databases Power BI just chooses or pulls the data from a database. |
Whereas, Tableau works on the columnar which is based on the structure that stores only unique values for each column that makes it possible to fetch Billions of rows. |
|
User interface |
The user interface of Power BI is inherent, and it can easily be integrated with other Microsoft products. Moreover, the Power BI interface is easy to learn and understand. |
User interface of Tableau :-has an intelligent interface that allows you to create and customize the dashboards according to your needs. It has an inviting workspace area that encourages you to experiment with data and get smart outcomes. Moreover, the workspace area has various cards and shelves, data source page, status bar, toolbar, sidebar, and sheet tabs. |
|
Machine learning |
Power BI is integrated with Microsoft Azure, as it helps in analyzing the data and understanding the trends and patterns of any business. |
The machine learning capacities of Tableau are inbuilt. As it makes it efficient for performing ML operations over the datasets. |
|
Performance |
Power BI can handle a limited volume of data. |
It can handle a huge volume of data with much better performance. |
|
Target audience |
The targeted audience of Power BI is Naïve Users or Experienced Users. |
Even though access is easy and simple, Analysts and exposure users use it for their analytics purposes. |
|
Pricing |
It is very cheap as compared to Tableau. |
Tableau is more expensive than power BI. It requires to be paid more when connected to third-party applications. |
Here, is the list of advantages of Tableau:
Here, are some advantages of Power BI:
Here, are some drawbacks of Power BI:
Here, are some drawbacks of Tableau:
Q1). Is power BI better than tableau?
Answer: In the Power BI VS Tableau debate the overall winner has to be Power BI according to me. It is easy to use, similar to Excel, and its affordable pricing makes it a great option for different types of businesses. Tableau still has unique benefits that multiple businesses and analysts will appreciate.
Q2). Tableau or Power BI, which one is easier!
Answer: Tableau is a little difficult as compared to the Power BI interface. When compared, Power BI is simple and easy to learn. As the information can be stored by using the Tableau server. And unlike Tableau, Power BI concentrates more on reporting and analytical modeling but not on storing the data.
Q3). Question: Should I learn Power BI or Tableau?
Answer: Tableau offers the cloud-based as well as installable model, but Power BI is delivered in Software as a service model. But if you dont require the Saas BI service, then Power BI is not for you. Unlike Power BI, Tableau has a more attractive and useful user interface. It offers the cloud-based as well as installable model, but Power BI is delivered easily; a dashboard can be created but this comes with a cost.
Q4). Question: What are the advantages of Power BI over Tableau?
Answer:
|
Power BI |
Tableau |
|
Power BI performs faster and better when the data volume is limited, but becomes slow while handling huge data. |
Tableau is suitable for handling huge volumes of data quickly and serves extensive features for visualizing the data. |
While comparing Microsoft Power BI VS Tableau, you really have to think about who will be utilizing these tools. Power BI is built for the common stakeholders i.e. necessarily a data analyst. Also, the interface depends on drag-and-drop and intuitive features to help teams build their visualizations.
It's a great addition to any team that requires data analysis software but without getting a degree in data analysis initially. Tableau is usually powerful, but the interface isn’t quite as intuitive, which makes it harder to use and learn. Moreover, those who have data analysis exposure will have less trouble cleaning and transforming data into visualizations, but those who are just getting their feet wet will likely feel overwhelmed with the upsloping battle to learn some data science before making visualizations.
Overall, we call this Tableau vs Power BI duel a draw. Power BI wins for ease of use, but Tableau wins in speed and capabilities. Moreover, small businesses with limited financial and human resources should start out with Power BI, especially if they have already invested in Microsoft products.
Moreover, medium and enterprise organizations that prioritize data analytics and have the human capital to support them will be better off with Tableau.
Tableau VS Power BI isn’t your only alternative for data visualization and data analysis tools. In case you're ready to seek your next business intelligence tool. Well, after the comparison we would suggest to you that both the tools are useful and helpful. You can choose whichever suits you the best. With JanBask Training, you can start your Tableau training and Microsoft Power BI Tutorial any time and be a professional in your field.
You share your thoughts or confusion in the below-mentioned comment section!
She is an expert in writing informative blogs and article. She is best known for IT, Technical trends and career path education. Anusha has been producing distinctive and engaging content for the end-users.

Cyber Security

QA

Salesforce

Business Analyst

MS SQL Server

Data Science

DevOps

Hadoop

Python

Artificial Intelligence

Machine Learning

Tableau
Interviews


 Nov 05, 2021
 7.4k
7.4k

Kyle Lee
I was too confused about choosing among power bi vs tableau. But after going through this comparison guide I felt Shopify best suits my needs so I will go with this and thanks for this great post.
JanbaskTraining
Glad you found this useful! For more such insights on your favourite topics, do check out JanBask Blogs and keep learning with us!
Arlo Hill
I found power bi is more affordable and also rich in features so going with power bi is my decision as it met all my requirements at low expenditure .
JanbaskTraining
Thank you so much for your comment, we appreciate your time. Keep coming back for more such informative insights. Cheers :)
Brian Taylor
Although both eCommerce are the best platforms at their place and shopify is best in terms of attractive teams and that is what I want.
JanbaskTraining
Thank you so much for your comment, we appreciate your time. Keep coming back for more such informative insights. Cheers :)
Aidan Johnson
Hey, thankyou for such an in depth comparison between power bi vs tableau , and have cleared all the confusion about how to choose and help with all essential knowledge related to both power bi vs tableau.
JanbaskTraining
Glad you found this useful! For more such insights on your favourite topics, do check out JanBask Blogs and keep learning with us!
henry
One of the best guides I have found on power bi vs tableau , but one question I have is how to compare the security aspect of the two.
JanbaskTraining
Hi, Thank you for reaching out to us with your query. Drop us your email id here and we will get back to you shortly!
Amari Jones
I didn’t know the difference between power bi vs tableau, though I have heard about them from my friends. But thanks to your blog details I got it clear in my mind. Thanks Team!
JanbaskTraining
Hello, JanBask offers online training to nurture your skills and make you ready for an amazing career run. Please write to us in detail at help@janbasktraining.com. Thanks!
Zane Brown
The article is informative and useful. I found it interesting to know about three things related to power bi vs tableau in a single article. I think it's a great initiative. Waiting for more blogs!
JanbaskTraining
Glad you found this useful! For more such insights on your favourite topics, do check out JanBask Blogs and keep learning with us!
Emilio Davis
Thanks for helping in the decision of choosing among power bi vs tableau, as both terms are new to me, I was not able to decide which one is more suitable for me.
JanbaskTraining
Thank you so much for your comment, we appreciate your time. Keep coming back for more such informative insights. Cheers :)
Knox Miller
Thanks for such a detailed comparison between the two, as i am a non techy guy both of these applications are bouncing from overhead but the way you explained is really well. Keep up the good work team!
JanbaskTraining
Thank you so much for your comment, we appreciate your time. Keep coming back for more such informative insights. Cheers :)
Adonis Smith
Hi guys I am still confused about which one is better among power bi vs tableau? Can you share any article link that can clear my thoughts on it.
JanbaskTraining
Hi, Thank you for reaching out to us with your query. Drop us your email id here and we will get back to you shortly!