
 Feb 13, 2020
  5.6k
5.6k

31
JulMonth End Offerl : Get 30% OFF + $999 Study Material FREE - SCHEDULE CALL
- Tableau Blogs -
In this article, we are going to talk about the different features we have available on the tableau server. We will also talk about some of the essential features of the tableau server which you should allow to the users and which should not be allowed.
Tableau Server is a premium product by tableau which is used to publish the report created in tableau desktop. It is a platform on which the user interacts with the dashboards. So, we can say tableau server is a kind of website where we publish our report. Here, you can allow users to view your report and interact with it. You can also control what kind of access the users should be having.
The alternative of the tableau server is tableau online. Usually, the tableau server is recommended when the organization wants to keep the infrastructure with them while tableau online is managed by tableau itself.
There are multiple features that tableau server has which makes it a perfect site for the reporting. On the tableau server, users can comment on your report, they can share the report with others, they can download the report in different formats, and the similar functionalities are available.
In this article, we are going to explore all those features which should be required from the user perspective to get the best out of the reporting.
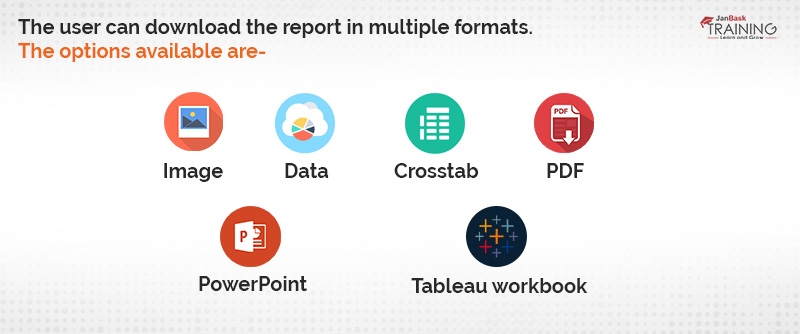
The user can download the report in multiple formats. The options available are-
Depending upon the version you are using for the tableau server, few for all options will be available to you. For example, if you are still using the versions of 2018 then PowerPoint might not be available for you as an option to download the report. These six options are from the new version of the tableau server.
If you want to download a dashboard for the report in the form of an image just click on the image and the file will be downloaded for you. This is recommended when you just need a single view from the dashboard available.
PDF is recommended when you need all the dashboards in the workbook and want to say somewhere, not just a single view.
Read: Power BI vs Tableau - Top 8 Key Differences
Data can be useful when you want to see which all data has been used while creating this report or dashboard. You may further want to share this data to be used in some other dashboard in purpose.
PowerPoint is recommended when you want to download a dashboard or a story to present to some stakeholders. This is an ideal format whenever you have to do some presentations. all the tabs of the dashboard will be into the different slides. Similarly, all the points of the story will be into different slides. Downloading a dashboard in the form of PowerPoint is the new feature added to the tableau server. There was a use Call Out for this feature from all the tableau users.
The last option tableau workbook can be used when you want to download the entire workbook and want to make certain changes. This option is typically being used by the developers of the dashboard of the testers. Usually, we allow the user to download the dashboard or the story in the form of an image, PDF, and PowerPoint. Again, if a developer wants to get the download access on the data, crosstab, or tableau workbook, you can allow them the related access. Downloading a tableau dashboard or a story is a very helpful feature in tableau and saves a lot of time for the users.
Another very useful feature on the tableau server is a comment. The comment feature allows the user to interact with the developer of the dashboard to the responsible person of those dashboards and the data showing in the dashboard. Many a time, there might be some glitches on the report for the data might not be refreshing correctly or some incorrect information might have been showing. The best way to get clarity on that path directly takes a snapshot of it and puts that into the comment box or you might want to send an email to the support person of that dashboard.
Tableau comment allows all the features where you can comment on the dashboard, take a snapshot of the report and put that into the comment section, you can also mention some specific person which you think might be responsible for all those in the comment section also. You can edit the comment, you can delete the comment and many similar functions which will be helpful while interaction.
You can also share the dashboard and a story with the others. There are a couple of options while sharing the report-
Just click on the share button at the top of the report and you will be getting a pop-up option. In the sharing options, there will be a code for sharing the link and another code for embedding the report. Now, depending upon a requirement, you might copy any of those codes or both the codes.
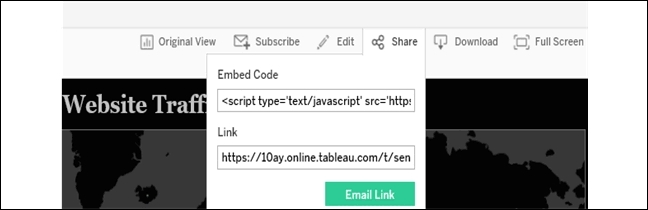
If you are in embedding a report, there will be multiple parameters that you can customize. For example, you can choose to show the toolbar or you may not. You may also choose to show the tabs in the dashboard but it is better to avoid doing that. There will be different parameters using which you can customize all these functionalities. Remember, when we are embedding a report to some other website, the comment feature won't be available.
Read: Tableau Data Connection - How to do it right?
You can also choose to email the link. Simply, provide the email id and the links will be shared on the email.
Tableau Online Training & Certification

This is a great future with a tableau server where you can subscribe to a report. You have the option to subscribe to just a single view of the entire dashboard. You may choose when you want the delivery in your email inbox.
Subscription can be utilized in a great way to track the progress of the business. For example, if you have a dashboard with the sales data and you want to review the sales data on a daily basis. So, instead of going to the dashboard every day, you can choose to receive an email on a daily basis to get the insight of the sales report. This way you can save a lot of time. Further, if you think there is something odd with the report you can click on the report that you have received in the email and it will be redirected to the original dashboard on the tableau server.
While subscribing to the report you must select when you want the report to get delivered, the subject line of the email, the content of the email, and similar other customizations.
You may subscribe to other users or an entire group as well. Just click on the subscribe option and you will get a popup option to customize all these features and options.
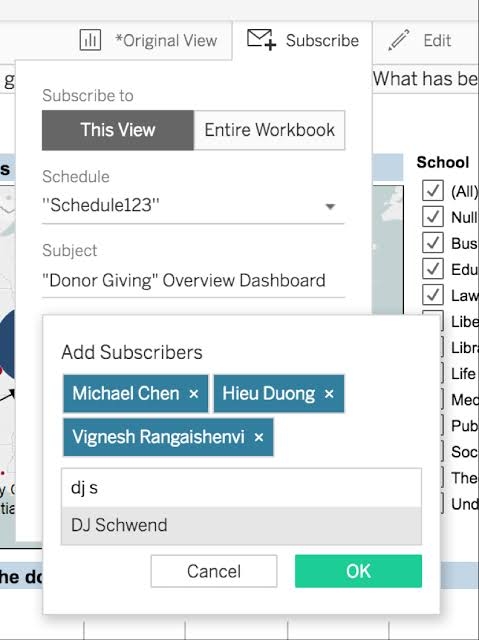
As you can see in the above image, we have two options, one to subscribe to this view while other for the entire workbook. Depending upon your requirement you may select any of these two options.
The view that you will be receiving the email might be a little different from what you are saying on the dashboard. So, you need to customize it as per your requirement.
Read: What is Group and How to Implement Grouping in Tableau?
There are many other similar features that users can perform. For example, users can interact with the filters given with the report and can play around the different data in the report. This way they will be able to get the exact view of what they are looking for.
The users can also set an alert on some specific reports for some proactive use. It is used if there is a sales dashboard where the sales are going almost steady. But if you want to know or get alerted when there is a huge fluctuation in the sales amount, in that case, you can make an alert on the sales for something of value and can get allotted whenever your sales are going above or down to that threshold value.
Tableau Online Training & Certification

This was all about some of the important features that we have available on the tableau server.
Being a user of the tableau server, you should leverage these features to use the tableau server as per the best of the capability.
Subscription, comments, and downloading features are something that is being used a lot. Depending on your requirement you might download a report and use it for the presentation purpose.
 FaceBook
 Twitter
 LinkedIn
 Pinterest
 Email
Email
The JanBask Training Team includes certified professionals and expert writers dedicated to helping learners navigate their career journeys in QA, Cybersecurity, Salesforce, and more. Each article is carefully researched and reviewed to ensure quality and relevance.


Gen AI

Agentic AI

AI in Automation Testing

Cyber Security

Data Science

QA

Salesforce Service Cloud

AWS
Search Posts
Related Posts
Receive Latest Materials and Offers on Tableau Course
Interviews


 May 19, 2022
 681.4k

 681.4k