What distinguishes Tableau software as a standout data analytics solution? Tableau enables connecting to and gaining insight from data as straightforward as it should be on all accounts. Experienced data analysts can use it to extract deep insights, while the most inexperienced Excel user can navigate with ease and discover exactly what they need.
This guide will walk you through the basics of Tableau for beginners and how to utilize it to investigate data, make intelligent and interactive dashboards, and specialty convincing stories with data. We'll begin with the basics, such as exploring the Tableau interface, associating with data sources, and building your first memorable worksheet. Then, at that point, we'll plunge into further developed highlights like computations, boundaries, and dashboard creation.
Data visualization is vital in today's modern world since it assists organisations in leveraging benefits buried in raw data. Simply said, data visualisation is the process of representing data in a graphical style for easy comprehension. Because large amounts of data are difficult to comprehend, data can be plotted into various graphic formats such as charts, maps, tables, infographics, and so on. Data visualisation aids in the comprehension and simplification of data, as well as the detection of patterns, trends, and insights from data.
Data visualisation provides a comprehensive view of market conditions and client needs. This could aid an organisation in developing plans and clever tactics to suit client needs and boost corporate growth. This reason has driven all data science businesses to develop and improve their data visualisation capabilities in order to extract value from vast amounts of data.
What Are The Various Data Visualization Tools
The top five business intelligence tools that are widely used for data visualisation are listed below:
Tableau
Qlikview
Domo
Microsoft Power BI
Qlik sense
Tableau: Tableau is the most widely used and sophisticated business intelligence application in organisations. The unique features and ongoing innovations in the tableau tool have contributed to its enormous popularity. With powerful dashboards and data connection tools, it converts raw data into an easily understandable manner. Tableau assists its customers in data analysis by giving deeper insights through attractive dashboards and workbooks.
Qlikview: Because of its flexibility in transforming data into knowledge, Qlikview is the most extensively used business intelligence tool. Qlikview enables users to easily aggregate, search, and graphically inspect their data in order to acquire valuable insights. Users can analyse data in numerous dimensions thanks to its dynamic model. Qlik Sense is easily integrated with a variety of data sources, including Oracle, SAP, Salesforce, Excel spreadsheets, and others.
Domo: Domo is a cloud business management suite that is open to all users, regardless of technological expertise. It enables seamless interaction with a variety of data sources such as databases, spreadsheets, social media, and any other cloud service. Domo provides a centralised dashboard through which you may obtain company-wide data at a glance.
Qlik Sense: Qlik Sense establishes the standard for the next generation of data visualisation. Its advanced features, such as an analytics engine, sophisticated artificial intelligence, and scalable multi-cloud architecture, enable everyone in your organisation to make data-driven decisions quickly, improving corporate development and performance.
Microsoft Power BI: Another popular and user-friendly data visualisation tool in the BI area is Microsoft Power BI. Additional drag-and-drop functionality with easy access to more than 80 data visualisation apps are included in this tool. Creating highly dynamic reports using a tool that can be shared with the team and accessible from various devices is always simple.
By utilising AI technologies like Power Query and Power Q&A, Power BI enables users to visualise unprocessed data and produce highly customised reports. Power BI allows even non-technical individuals to discover hidden patterns in company data. Tableau and Power BI have several differences. For example, Tableau provides all types of charts, bars, and graphs, whereas Power BI just includes regular charts, graphs, and maps.
What is The Significance of Data Visualization
Data visualization is critical for acquiring insights and figuring out trends in your data. While Tableau has powerful data visualization capacities, it’s important to learn some fundamentals. Visualization permits us to detect trends and trends that would somehow be challenging to find in crude data alone. By changing data into visual graphics like charts, diagrams, and maps, we can rapidly identify insights offer them with others. Probably the most widely recognized kinds of visualizations in Tableau include:.
Choosing the right visualization type is vital. You want to decide the relationship you need to examine in your data and pick a chart that will appropriately showcase it. Try not to simply default to a bar or line graph. Get to know the different visualization choices in Tableau and ponder how everyone could give a unique view into your data. With the capacity to make modified dashboards, Tableau makes data visualization simple and interactive. You can blend different visualizations into a single dashboard to get a significant and high level overview and share effective experiences with skateholders. Utilizing effective data visualization, you'll be on your way to turning into a Tableau master.
Our online business intelligence analysis courses, which include in-depth instruction on BI, Tableau for beginners, and Microsoft BI, will help you improve your company operations.
Tableau is a data visualization tool that permits interactive analysis of data. It changes exhausting lines and segments of numbers into engaging, interactive dashboards and reports that are easy to understand. It's easy to use, so you needn't bother with to be a data scientist or have programming experience to make visualizations that give insights.
Tableau has a drag and drop interface, so you don't have to know how to code to utilize it. You can just connect Tableau to your data, then drag and drop to examine and visualize it. Whether your data is in a spreadsheet, data set, or cloud service like Google Analytics or Salesforce, Tableau can associate with it.
To start, you'll have to connect Tableau to your data. This could be a excel file, a data set like SQL Server or MySQL, or cloud-based data like Google Investigation.
Then drag and drop to make interactive dashboard. Add various diagrams like bar graphs, line charts, pie graphs, dissipate plots, or intensity maps. Drop in filters, timelines, or other interactive components. Design text styles, colors, and the format to make it outwardly engaging.
The way to mastering Tableau is practice. Take Tableau's free e-learning courses, follow instructional tutorials to assemble different dashboard models, and participate in their dynamic community forums. In no time, you'll be an data genius! Tableau can open many professional doors, so begin improving your abilities today.
The rising Google trends is clear evidence of the increase in the demand for Tableau-certified experts worldwide. The Tableau Certification Path is explained in detail here:
Some of the Amazing Facts About Tableau
Here are some of the important facts that makes its a higly desired tool in today’s corprate world:
Implementation and support require almost minimal IT resources. Tableau installs on your hardware via web download and is ready to use in around 20 minutes. Because it connects with Active Directory, installation is quick and easy.
Tableau Server requires no desktop software to install, update, or manage.
Users can access the content through their web browser without the need for any downloads or plug-ins.
Tableau adheres to your current security protocols.
Tableau does not transfer your data. Tableau runs its queries on the database and simply shows the graph or chart. The data is safely stored in your existing database.
Tableau Server helps to reduce network traffic. There will be no more e-mailing of Excel spreadsheets or Access databases. Report PDFs no longer need to be emailed. Tableau queries do not retrieve data.
Tableau Server views can be incorporated in business portals such as Microsoft SharePoint.
Tableau provides excellent end-user assistance, allowing IT professionals to focus on strategic challenges.
Tableau is a commercial partner of IBM, Oracle, and Microsoft.
Tableau Server and Tableau Desktop applications are already in use by thousands of businesses.
Tableau Desktop has no hardware requirements and does not require a dedicated server.
Tableau is an extremely well known tool utilized by data scientists, analysts, and business clients around the worlds. Learning Tableau is an extraordinary method for supporting your Tableacareer and discovers experiences in your data like never before. The best part is, Tableau has a free product called Tableau Public that you can use to get familiar with the device and build a portfolio of data visualizations to flaunt your abilities.
Tableau is a strong data visualization tool that permits you to explore and figure out your data in new ways. There are a couple of key reasons for why Tableau is worth learning:
Easy to use : User Accesible
Tableau is intended to be instinctive and easy to use. Even if you have no specialized technical background, you can begin rapidly. Tableau's drag and drop interface permits you to just drag fields onto shelves to make various views on your data similar to diagrams, charts, and dashboards. You can easily change between various visuals to reveal insights of stories in your data.
Visualize and Data: Effective Visualization
Tableau can connect with virtually any data source, from spread sheets and SQL data sets to Hadoop and cloud data platforms. Whether your data is in a .csv record or a SQL server, Tableau permits you to effectively interface with it and begin analyzing. You have the flexibility to combine data from various sources into a single view.
Share Insights: Indepth Discovery
Whenever you've found significant insights in your data, Tableau makes it simple to share them to other people. You can make interactive dashboards and stories that permit individuals to explore the data on their own. You can export static versions of your visualizations to implant in blog posts, sites, and presentations. Tableau even has choices to share your work to peoples who don't have a Tableau license or account.
Constant Advancement: Automate Innovation
Tableau is continuously improving and delivering new highlights to assist you with acquiring important insights from your data. With each new version, Tableau pushes the abilities of data visualization and analytics further. New AI highlights assist you with recognizing exceptions, trends and examples. Mapping features give spatial setting. There are numerous opportunities for data exploration with Tableau.
With a short learning curve, the capacity to connect with any data, strong visualization capabilities, and choices to share your insights, Tableau is a must have priority expertise in the present data-driven world. The opportunities for data storytelling and gaining significant experiences are endless. Tableau can take your logical and data presentation abilities to a next level.
Tableau has numerous practical applications for data visualization and examination. The following are few of the fundamental ways people are utilizing Tableau:
Data Exploration: Tableau is a powerful tool for investigating your data. You can easily interface with your data, drag and drop fields onto the view, and filter, sort and gathering your data. This simplifies it to uncover insights and trends in your data. Numerous data analysts use Tableau as a discovery tool prior to doing further factual analysis.
Dash boarding:Making intelligent dashboards is quite possibly Tableau's most popular use. You can build wonderful dashboards that consolidate various charts, diagrams, guides and tables. Viewers can then filter the data and watch the whole dashboard update quickly. Dashboards are a fabulous method for checking key metrics, spot trends and offer insights.
Visual Storytelling: Tableau has features that permit you to make data stories - strolling the viewer through a sequence of visualizations and dashboards. Utilizing intelligent components like filters, tooltips and explanations, you can take the viewer on an exploratory journey through the data. Storytelling is a convincing method for finding and share insights.
Reporting: Numerous associations use Tableau to create and distribute data reports reports. You can create reports with dashboards, visualization, tables, and text boxes. Reports can then be printed, embedded on sites, or emailed to associates and clients. Tableau gives you a simple method for making your data reports engaging and interactive..
Tableau is a flexible and versatile tool with numerous applications for exploring, analyzing and sharing data. Whether you're building dashboards, revealing insights, telling data stories or detailing key metrics, Tableau takes care of you. The potential outcomes are immense, so begin exploring your data today!
Tableau Product Family
The Tableau Product family has something for everybody, from people to large ventures.
Tableau Desktop
This is Tableau's original product. It's a powerful and instinctive desktop application for analyzing data and making interactive dashboards, reports, and data visualizations. In case if you are just getting started with Tableau, Desktop is an incredible place to start creating your data analysis and visualization skills.
Tableau Prep
Tableau Prep, previously Tableau Prep Developer, is Tableau's tool for combining, shaping and cleaning data before analysis. Use it to aggregate, filter, pivot, split, union, join, merge, and control your data from various sources. Prep will save your time via automating large numbers of the tedious data preparation tasks expected to prepare your data for analysis in Tableau.
Tableau Online
Tableau Online is Tableau Software’s hosted SaaS environment. It gives core functionality as Tableau Server yet without the need to deploy and maintain hardware. Similarly as Server, you can distribute manuals, dashboards, and data sources to the web and offer them with partners. Online might be a decent low-maintenance, low cost choice if you need to get everything started with sharing and collaboration.
Tableau Server
Tableau Server is an enterprise level platform for distributing and sharing Tableau manuals, dashboards and data sources. It provides collaborations governance, adaptability, and security highlights for data analytics at an organizational level. To share your Tableau visualizations or analyze with colleagues or make them accessible to others in your organization, Server is the best approach.
If you want to learn more about Tableau server, visit Janbask Training and take the tableau training.
Tableau Public
Tableau Public is a free cloud-based offering that permits anybody to make and share intuitive data visualizations online. Although restricted to public data and sharing, Public is an incredible way for beginners to begin learning Tableau for free. You can interface with public data, create visualizations and dashboards, and publish them to share to the world.
Till now we have covered the fundamentals of Tableau; for a more thorough explanation of how it functions, visit our Tableau Data Visualisation Tutorial.
Steps to Learn: How to use Tableau
To master Tableau , you really want to begin with the fundamentals. Once you understand the basics, you'll be creating powerful data visualizations in no time. Here are some steps that will help you to learn how to use Tableau for beginners:
Add a Data Source
The initial step is to connect Tableau to your data. Tableau can connect with numerous data sources, as Excel files, SQL data sets, Hadoop, and cloud applications like Google Analytics. Connect with to your data and Tableau will naturally identify fields, data types, and relationships. You can then form visualizations, dashboards and stories based on these data.
Build Your First Visualization
Drag and drop fields onto the Rows and Columns shelves to begin analyzing your information. Tableau will automatically visualize the data, usually as a bar graph, line chart, or guide. Then, you can look over Show Me, a menu of visualizations types, to change to an alternate view. A few choices include heat maps, tree maps, word clouds, and scatter plots.
Modify Your Viz
Once you have your initial visualization, tweak it by adding titles, names, arranging, filtering measuring, coloring, and tooltips. Make selections to highlight key insights. Design the visualization to best show your information by changing the size, variety, shape, and label. Add reference lines or trend lines to give context.
Use the Pages shelf to create dashboards with multiple visualizations. Add interactive filters to your dashboard to control multiple views at once. Build stories to take your audience through a data narrative with captions, interactive elements like filters, and seamless transitions between visualizations.
Tableau makes data analysis and visualization easy. Follow these steps to connect your data, build visualizations, customize your analysis, and create dashboards and stories to share insights with others. You'll quickly become a Tableau expert with regular use! If you have any further queries, please comment down below.
Data analysis and visualisation are made easier using Tableau. To learn Tableau from scratch, follow these steps: link your data, put together visualizations, fine-tune your analysis, and create dashboards and stories to share experiences with others. With standard use, you'll be a Tableau genius in no time.
JanBask Training has compiled the most frequently asked questions from the interviews for this Tableau practise test. Examining your understanding of Tableau will help you feel more confident and motivated to learn more about the technology.
Tableau Top Features and Strengths that Sets Tableau Apart from the Best
Tableau has numerous helpful features that make data analysis and visualization simple. Here are some of the top qualities and skills of Tableau:
Drag and Drop interface: Tableau has an instinctive drag and drop interface that allows you effectively to analyse your data simply by clicking and dragging dimensions, measures, and filters onto the view. No complex code or queries are required.
Interactive dashboards: Tableau simplifies it to make interactive dashboards that permit you to filters, feature, and drill down into your data. Users can ask and address their own inquiries by connecting with your dashboard.
Real time data connection: . Tableau can connect live to numerous data sources like records, data sets, and cloud applications. This implies your data visualizations are always up-to-date as your source information changes.
Mapping: Tableau has implicit geocoding and mapping capacities. You can make custom guides to analyze and show geological information, and even add layers with demographic data.
Data Blending: Tableau permits you to join information from numerous sources into a single view, regardless of whether the information sources have various designs, sizes, or configurations. You can blend data at an aggregated or granular level.
Collaboration: Tableau Online and Tableau Server permit groups to team up on dashboards, reports, and exercise manuals. You can safely share your examination, leave remarks, and get notices when information is refreshed.
Scalability: Tableau is built to scale and deal with enormous information volumes. It uses data extricate engine, in-memory data structures, and different methods to guarantee quick response time, even on huge data sets with a large number of rows
With these valuable features, it's not difficult to see the reason why Tableau is a leader in business intelligence and data visualization. The software gives you a simple yet powerful method for analyzing and grasps your data.
How can I use Tableau for free?
Tableau offers a free version of their data visualization software that is ideally suited for learning the basics and building your first dashboards.
Tableau Public
A free cloud-based platform called Tableau Public enables you to create and distribute interactive data visualisations.
Connect with various data sources like Excel sheet, SQL data sets, and cloud applications
Construct dashboards, worksheets, and stories to explore your information
Share your visualizations with anybody online.
The catch is that all workbooks you distribute are publicly available. In this way, Tableau Public is great if you’re simply beginning with data viz or have an personal project you need to transparently share.
Limitations of the Tableau
Since Tableau Public is free, there are a few constraints to know about:
All exercise manuals are public - it's absolutely impossible to keep them hidden.
Restricted data sources - you can't connect with private data sets or records.
Less advanced features - a few advanced features like binned scatter plots, estimating, and forecasting are just in the paid variants of Tableau.
No help - you can't contact Tableau for specialized help. Community support as it were.
Yet, for learning Tableau and building your first dashboards, Tableau Public has all the essential features fundamental elements. Furthermore, when you're prepared for more, you can continuously move up to a paid Tableau access.
Future Scope of Tableau
According to the US Bureau of Labour Statistics, software developers, including Tableau developers, will expand at a 25% annual pace between 2021 and 2031, which is significantly faster than the national average.
Because of the rising dependency on data, data visualization has grown in popularity over the years. Companies are now solely reliant on data given through numerous devices, and the volume of this data has grown over time. As a result, organizations are turning to data visualization to make data-driven decisions. Tableau has been named a top-ranked visualization tool by Gartner for several years. Consistent improvements to Tableau's features and functions assisted it in staying ahead of its competitors. People who learn Tableau have a lot of work prospects, and organizations pay decent salaries to Tableau professionals.
Why should You Learn Tableau?
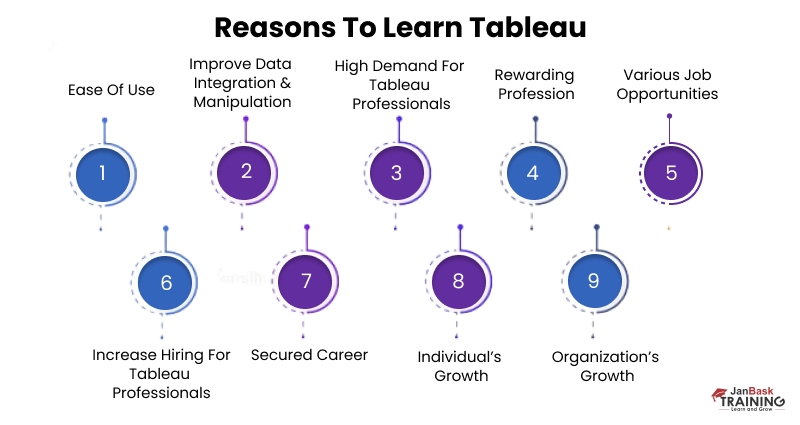
There are a few convincing motivations behind why learning Tableau is a smart career move:
Tableau is the leader in business intelligence and data visualization. By learning Tableau, you open yourself up to many exciting profession as a data expert, business intelligence engineer, or data scientist. Tableau sills are in high demand, and Tableau specialists are paid well indeed.
Tableau makes data analysis and visualization simple. You don't require advanced technical or programming skills to begin exploring and understanding your data in Tableau. It has a drag and drop interface and built-in tools that permit you to rapidly make interactive charts, dashboards, and visualization.
Tableau works with numerous data sources. You can connect Tableau to files, data sets, Hadoop, cloud applications, and spread sheets. This implies regardless of what data you have or where it resides, you can analyze it in Tableau.
Tableau produces wonderful visuals that give insights. Tableau's visuals don't simply look nice; they are intended to highlight significant data, trends and exceptions in your data. Spotting insights and trends through data visualization is a lot quicker and more intuitive than figuring out rows and columns of numbers.
You can make interactive dashboards to share. In Tableau, you can construct dashboards that combine interactive charts, graphs, guides, maps and more. These dashboards can be shared on the web, installed into site pages or web journals, or conveyed through PDF. This makes it simple to share data experiences and stories to associates or clients.
Hence, Tableau is a fundamental skill that opens up many energizing career opportunities. It permits you to acquire important experiences into your data through interactive visual analysis and offer those insights with others rapidly. Any one can learn Tableau and utilize it, regardless of technical background. Therefore, learning Tableau is a smart investment in your future.
Being referred to as a certified tableau expert greatly improves your chances of participating in projects that need for analytics expertise. You will realise that Tableau Certification was worthwhile at that point.
FAQs
1.What exactly is a Tableau tool?
Ans:- Tableau is a data visualisation tool that links to a variety of data sources (data warehouse, database, Excel, and so on). This Tableau data visualisation tutorial will teach you how this tool gives instant insight by translating data into an interactive dashboard, as well as how Tableau's data analysis is fast and professionals of all levels can understand the data.
2. How much time does it take to learn Tableau?
Ans:- It varies from individual to person. You can accelerate your learning by enrolling in Intellipaat's Tableau course. This finest Tableau tutorial will help you learn Tableau's dashboards, reports, data mixes, tables, Tableau architecture, Tableau components, and other features.
3. Why should we learn Tableau?
Ans:- Tableau is transforming the way people use data to address real-world problems. According to Gartner, Tableau is the global leader in BI systems, accounting for approximately 16% of the BI market. Thus, learning Tableau will assist you in becoming expert in the programme and obtaining a fulfilling employment.
4. What are Tableau's best features?
Ans:- Tableau is a fantastic application known for its data blending, real-time analytics, and collaborative capabilities. All without any technical or programming experience. In this comprehensive Tableau course, you'll learn why its popularity has spread so far and wide - corporations, researchers, and IT experts all adore it!
5. Tableau or Excel: which is superior?
Ans:- Tableau is far superior in terms of speed and accessibility. Tableau is in high demand because most businesses are dealing with Big Data issues. Excel has data limitations (limited rows and columns).
Summary
By now you have the knowledge of basic features the help you to get started as a tableau expert. Since it has become so obvious how to connect with information, assemble visualizations, make dashboards, and share your work, the possibilities are endless. Tableau is an unbelievably useful asset; however the key is just diving and practicing.
Don’t afraid to experiment - mess with various graphs and measurements, customize everything however much you might want, and in particular, mess around with it! The more you use Tableau, the more productive and creative you'll turn into. You have this! Now go forward and overcome the world of data with your newly discovered Tableau superpowers. The data revolution is here, are you prepared to join?
The JanBask Training Team includes certified professionals and expert writers dedicated to helping learners navigate their career journeys in QA, Cybersecurity, Salesforce, and more. Each article is carefully researched and reviewed to ensure quality and relevance.

 Sep 28, 2023
  3.7k
3.7k


 Feb 19, 2020
 6.9k
6.9k

Jax Williams
This article on what is Tableau software and what is Tableau used for is very helpful, and I’m very grateful to you for sharing the awesome article.
JanbaskTraining
Thank you for reaching out to us! Drop your email id here, and our experts will get back to you soon!
Amari Jones
Do you have any idea regarding DV tools that are most commonly used by marketing and advertising companies?
JanbaskTraining
Thank you for reaching out to us! Drop your email id here, and our experts will get back to you soon!
Zane Brown
Do you also provide corporate training? If yes, how to go about it?
JanbaskTraining
Thank you for reaching out to us! Drop your email id here, and our experts will get back to you soon!