26
SepGrab Deal : Upto 30% off on live classes + 2 free self-paced courses - SCHEDULE CALL
In this article, we are going to talk about what a Tableau set is and how to use the Tableau set in a report. We will also talk about the different features we have in the set and what are the differences from a Tableau group. Lastly, we will talk about how you can combine the set and application of Tableau sets. Keep reading to get an insight into the Tableau set and why you should use that while creating a report.
Have you ever thought of comparing and asking insights from a part of your data?
If yes then Tableau set is a perfect answer for you. It is a custom field used to store the subset of data based on some condition. For example, let’s say you have a column called a category. In that column, We have around 20 different categories. Now, if you want to select the column category and you want to make that column subset and want to select only a few or required number of categories, you can accomplish this with the help of a set in Tableau. You can also create a Tableau set in real-time. Create a set by just selecting the member from the list for the view and right-click on it and select to create the set. You will find a separate section that has been created in the data pane with the name sets and inside that, you will be having the set created with the name you have provided while creating the set.
Tableau set helps you and your audience to interact directly with the dashboard oratory on the Tableau Server or Tableau Online. When you select marks in the view, the set action can change the value of the set. Another way to create a set is just by writing the condition for selecting some top-level records or some bottom level records from a given measure or dimension.
The best thing about the set is you can even create a dynamic and interactive with the help of set actions. This helps your audience interact directly with the visualization on the server and do the analysis as per the requirement. In the next section, we will talk about how you can create a dynamic set.
Dynamic sets are those sets where the members of the set can change as data changes. The limitation is, you can create a dynamic set based on just a single dimension. To create a dynamic set in Tableau you can follow the below steps-
1. Right-click on any dimension and select create followed by a set
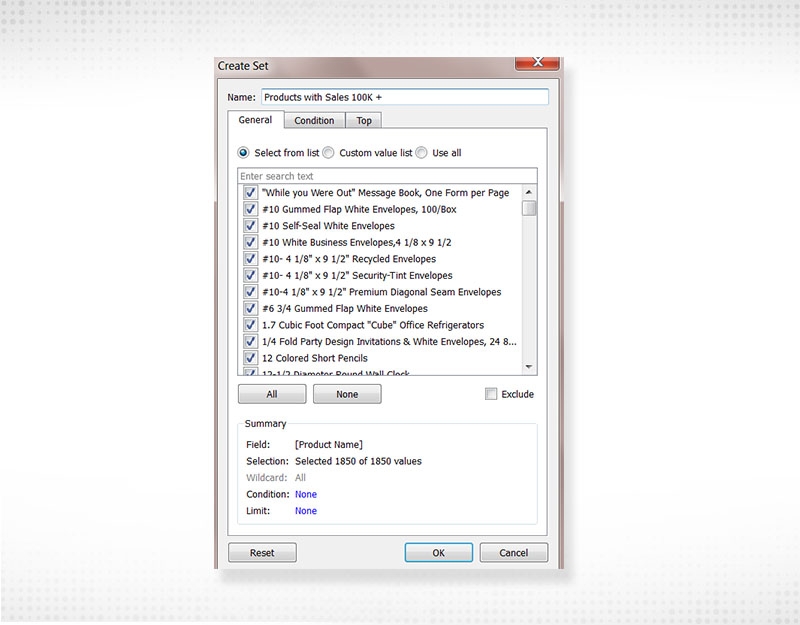
2. You will get a dialogue box there where you can configure yourself. In this dialogue box, you will be having three tabs-
a. General
b. Condition
c. Top
Read: Tableau Careers - Know Why & How to Make a Career in Tableau!
3. In the general tab also, you will be having three radio buttons-
a. Select from list
b. Custom value list
c. Use all
4. All these options work in the same way, a filter works in Tableau. If you are not sure about how a filter works, you can check our previous articles. In the select from the list option, you can select one option on multiple options for all the options. In the case of a custom value list, you can search for the value and select the desired result. While in the last radio button use all, all the options will get by default selected. The best thing about using all radio buttons is, whenever a new record will get added in that column or removed from the column it will get automatically updated. While for the rest of the two options, you will have to update this manually.
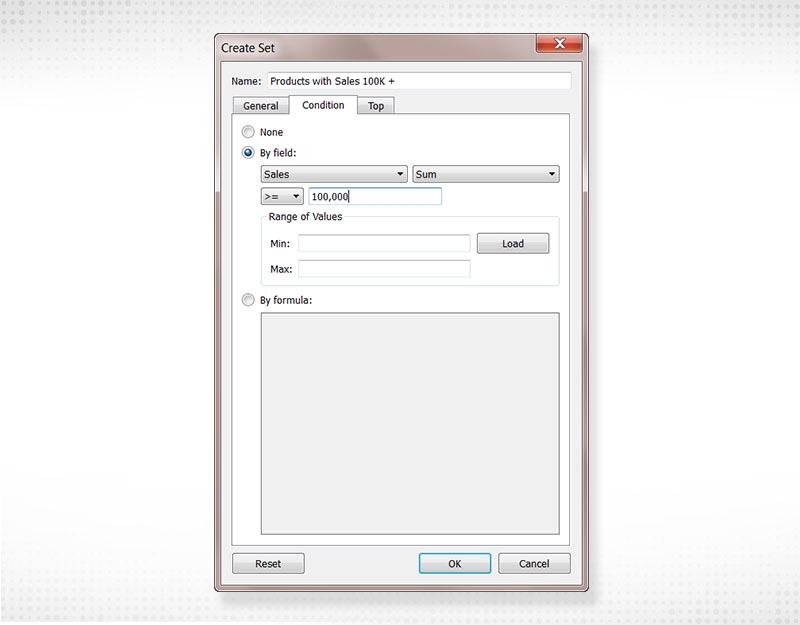
5. The next tab is called a condition. Here you can create a set based on the conditions given. By default, none will be selected but if you want to apply some condition based on the field, you can select by a field radio button. Later you can write about your conditions. These conditions may be a total profit greater than 5000 or sales less than 50000 or similar. The best thing is you can even provide the range of the value. For example, if I want only those members in my set where the cells should lie between 10000 to 20000. Then for such cases, you can use a range of values option. If you are not sure what the minimum and maximum value of a particular major is, you can use the Load button to load the minimum and maximum value of that particular measure. At last, if the field option is not working great for your requirement, you are always independent to write your custom code. For that, you can select by a formula radio button. Here, you can write the code in the same way you write a calculated field.
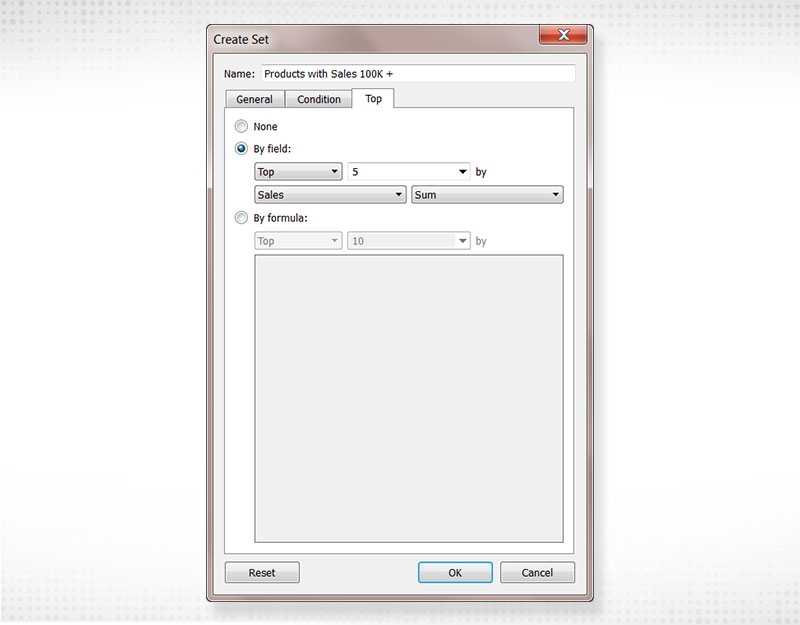
6. The last time on this dialogue box is for the top selection. Again, by default, none will be selected in this tab but if you want to select some top-level members for some bottom level members, you can select by a field radio button. Here, there is a dropdown box which has two values -
a. Top - if you want to select the top members of that particular dimension based upon some measures you can select top which is the default selection in this dropdown box. For example, if you want to select the top 5 categories based upon the sales you can keep the top option in this dropdown.
b. Bottom - if you want to select bottom members of that particular dimension based on some major you can select bottom from the dropdown box. For example, if you want to have the bottom 10 members of a given dimension in the set, you can select the bottom from the dropdown and add the conditions further.
Tableau Online Training & Certification
Read: Tableau Career Opportunities: What You Need to Know About Tableau in 2025

In the next dropdown, you need to put how many top-level members for or how many bottom level members you want to select or add into the set. Later you have to select the major name and aggregate functions. For example, if you want to select the top 10 members of the state based on the total sales. This means we are looking for those States where we have got the top 10 sales. In such a case, you need to select top from the first dropdown, need to type, 10 in the second dropdown, sales in the third dropdown, and sum in 4th dropdown.
This way, you will be able to create a set with 10 members and ocean members will be the highest sales state. For that, you can also apply the formula here if the first option is not working for you. Again, you can write the formula the way you write a calculated field.
7. Once done, just click ok and you will find and you said getting created in the sets section. You can use this set anywhere as per your requirement.
In the last section, we have talked about how you can create. So, once you have created the set, you can use that set in the report. For Example, let’s say you have created a set with some top categories based upon the sales. Now you want to use that set to show the profit. To do that you can, drag that set into the row shelf.
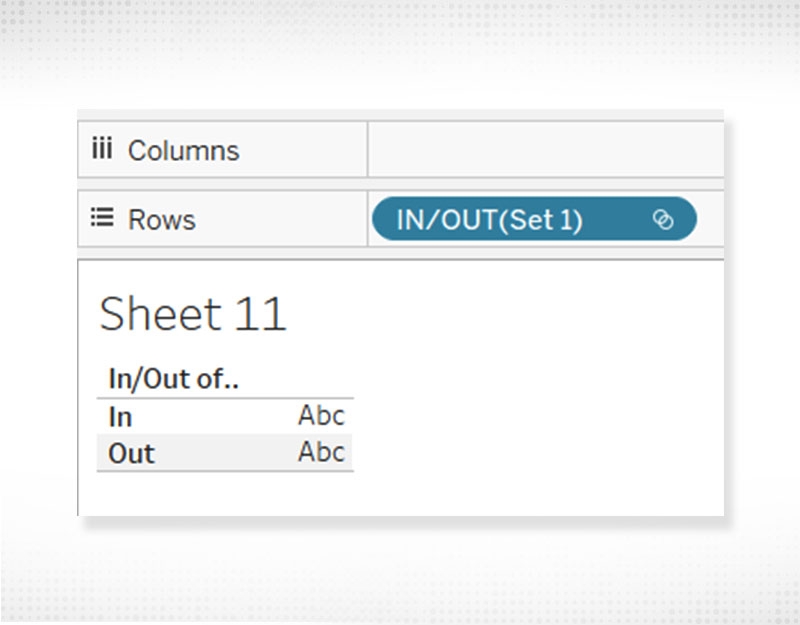
When you will drag the set into the row shelf or into the filter shelf, you will find two options being shown over there-
Read: A Complete Guide On Dual Axis
If you want to see the members of the set just click on the set and select so members in the set -
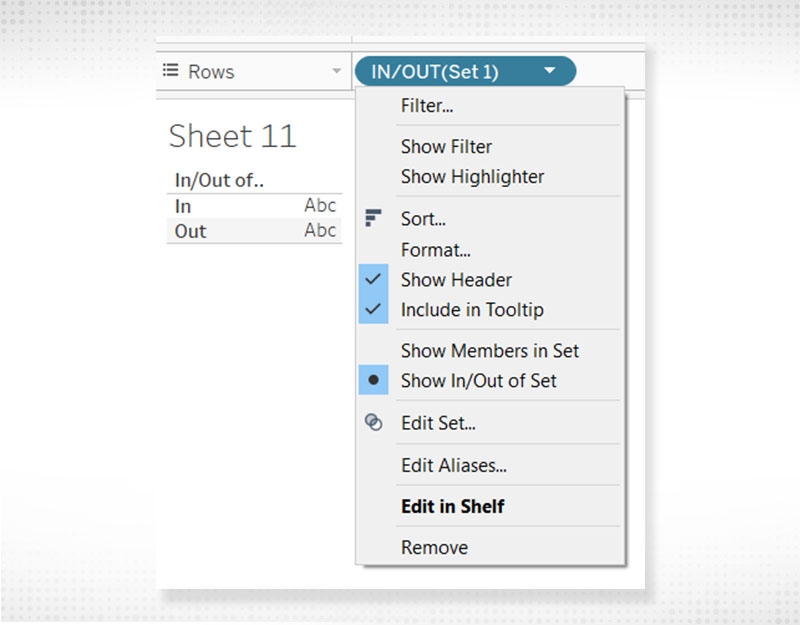
This way, you can use the set in the report and can get your work done. Apart from using the set in the report, you can also use this as a filter. There can be multiple requirements where you don't want to show all the products in the filter and want to show only 10 or 15 products to the user. Whenever you have this kind of requirement you can create a set and use that set as a filter. Further, you can combine two separate sets as well. To do that, just right click on both the sets and select create a combined set. Resolving the functions will be the same.
Tableau Online Training & Certification

This was all about the set in Tableau. Here, we have talked about what is a set, when to use set, and how to create a set. Later, we have also talked about how to use that set in the report and as a filter. You can try creating the set and let us know if you face any difficulty.
 Pinterest
 Email
Email
The JanBask Training Team includes certified professionals and expert writers dedicated to helping learners navigate their career journeys in QA, Cybersecurity, Salesforce, and more. Each article is carefully researched and reviewed to ensure quality and relevance.

Cyber Security

QA

Salesforce

Business Analyst

MS SQL Server

Data Science

DevOps

Hadoop

Python

Artificial Intelligence

Machine Learning

Tableau
Search Posts
Related Posts
A Complete Guide to Hierarchy in Tableau
![]() 5.6k
5.6k
Tableau Career Opportunities: What You Need to Know About Tableau in 2025
![]() 6.1k
6.1k
Know Average Tableau Developer Salary for Freshers & Experienced Professionals!
![]() 10.7k
10.7k
Tableau Desktop Certified Associate Exam Guide, How to Apply & Prepare
![]() 5.1k
5.1k
How to Interact with the Content on the Tableau Server?
![]() 4.1k
4.1k
Receive Latest Materials and Offers on Tableau Course
Interviews