26
JulInternational Womens Day : Flat 30% off on live classes + 2 free self-paced courses - SCHEDULE CALL
In this article, we are going to talk about how a business user can interact with the tableau server. So, when we say, interacting with a business user to the tableau server, we mean majorly with the reports that we have published on the tableau server. This consists of finding the desired data, generating useful insight, downloading the required report and others. We will also talk about how a user can interact with the content on the tableau server.
If you access the sites on the tableau server or online you can log in to the website or server to access the content available over there. The options that you will be getting on the tableau server might be different for the users. This heavily depends on the access level. For example, the tableau server administrator will be having access to almost everything while a project lead for a Site Explorer might be having access to something limited to the user. On a similar line if you might be having very few options and access.
But one thing will be common to all the users and that is the power to explore the data and generate the inside from the dashboards. Once you log in to the tableau server site you may find different options like projects, sites, users, workbooks, data sets, and others. You may go through those resources as per your requirement. Here in this article, I am going to talk about a few important steps you should understand while interacting with the content on the tableau server or tableau online.
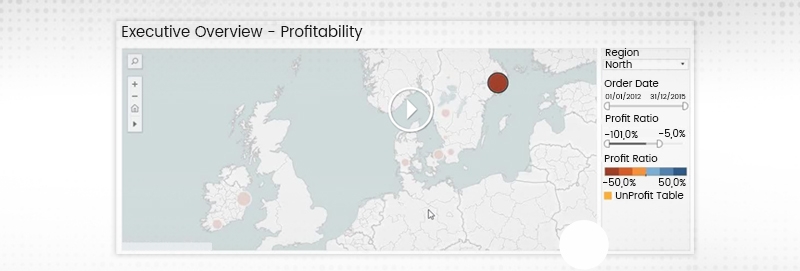
As you can see above, we have A dashboard that has been published which consists of a map chart and there are few filters over there. You can play around these filters to get the required data from the graph.
One thing that you need to understand is how to use these filters. For example, here the first filter is a dropdown box from where you can select a value. Then we have a slider for the order date. Depending on the order date you want to select you can slide this slider.
Next is a profit ratio which is also a slider and again you can scroll this slider select the desired range of profit.
There can be multiple other kinds of filters as well and some dependent filters as well. You can make use of these filters to get the desired data on your dashboard.
You can play on the dashboard to check the data that are being used to create this dashboard for example, if you want to know more about a particular city like Stockholm, you can check the icon indicated there to the full data for that particular City. Using the underlying data, you can see the individual transactions for this specific area of profitability in negative.
Read: Introduction to Data Visualization with Tableau
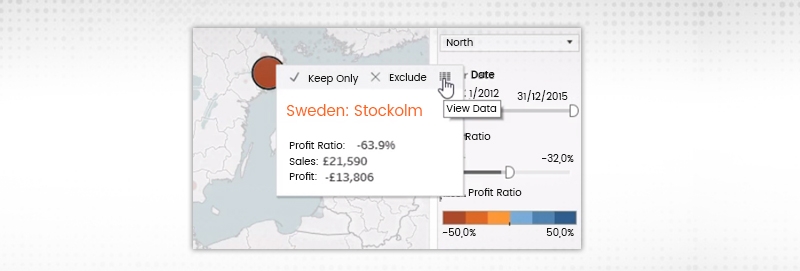
If the developer has not provided any specific icon to download the underlying data, you can click on the download option and select either crosstab or data. You need to have some specific permission to get these two options enabled. If you are not getting the option to download the data or the cross tab you can connect to the developer of the dashboard to allow you the option for you may also connect to the administrator to get you the access.
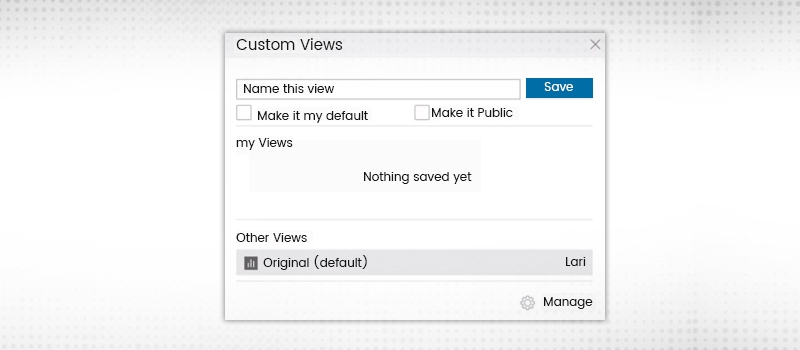
This is another important and very helpful feature that we have on the tableau server. Here you can choose to create a custom view of the dashboard also. For example, you have a global sales dashboard but you are only responsible for the European region. In this case, you might use the region filter to select Europe from that filter. Now, if you want to create your custom view for the European region only you can do that on. So, just hover on the dashboard and select save your view option. Anytime, if you want to see the original version of that dashboard you can simply select the option view as the original.
This way you can always come to the specific configuration of the dashboard and at the same time look for the problematic areas as well.
You can also share your custom views by making it public so that others can see the inside those you have found in the dashboard and the data. You always have the option to toggle between the custom view that you have created and the original view who the developer has created for the user.
Tableau Online Training & Certification

If allowed, the users will be having the function and comment on some specific Dashboard or views. If a user wants to ask some questions on a view or have some issues while seeing or have some issues while accessing the view, they can easily interact with the developer. This saves a lot of time which might take to reach out to the support team by tickets or email or call.
Read: Tableau Careers - Know Why & How to Make a Career in Tableau!
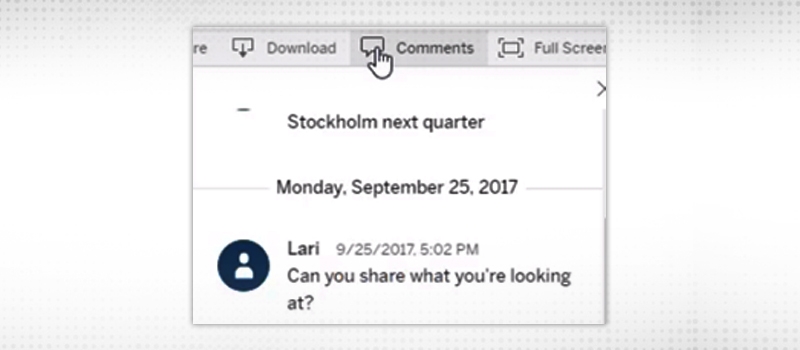
While interacting with the support team or the developer of the dashboard, the user may also select to insert the snapshot of the dashboard. This will help the developer or the support professionals to get the issue quickly.
Another helpful feature is that you can implement or use the tableau server or tableau online. You can choose to download a given dashboard or a story or view either in the form of a PDF, an image, or a PowerPoint. Although PowerPoint has been recently added to the tableau server and so if you are using the older version of Tableau server this option might not be available for you.
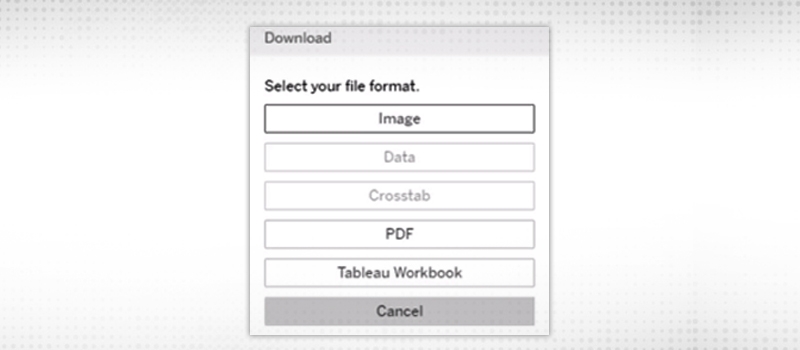
Apart from downloading the dashboard and a story, you can also choose to download the data used to create those dashboards and the stories. For example, you can download the entire data just by selecting the data option from the download or you can choose to download the crosstab which will download the data link to Doosra sport in the form of a CSV file.
If you are a developer or tester, you may choose to download the Tableau workbook as well. When we download the Tableau workbook, it will be downloaded in the format of .TWBX.
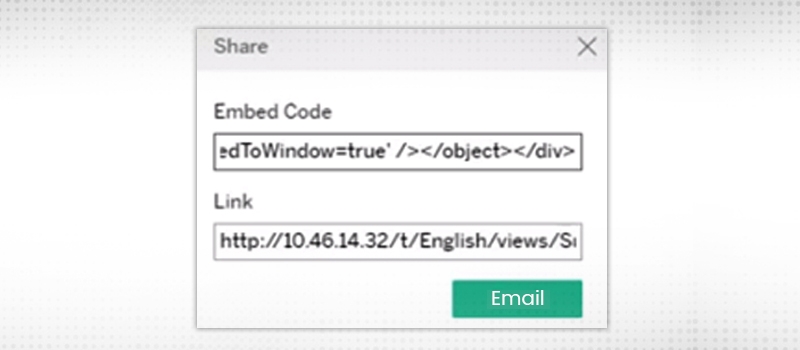
This is another useful feature that you can use on the tableau server. Here you can send an email or embedded a dashboard using the links that can be found under share option. You can either share this dashboard using the email or can use the link and share it with others. You can also choose to embed this dashboard or the story on some third-party applications. The person who will be using this dashboard from the third party will be asked to put the credential to ensure security.
Read: Tableau Server Certification Associate Preparation Guide
You will also be having the option to subscribe to a specific report or a dashboard, story or a view. Subscription means you will be getting an email on the scheduled time while subscribing. You can choose to subscribe to Yourself by visiting the tableau server for the developer of the admin can subscribe to you as well. The subscription option saves a lot of time and you can get an alert at the defined time in your emails.
The email will have a static image of the view from the time the email has been sent and when you will click on that means you will be redirected to the original dashboard.
The user can subscribe to themselves or others or even a group of users. The user will also have the ability to subscribe to a particular view on the entire dashboard. They can select when they want to receive the email, provide some specific subject line of the email, and a custom message in the message box.
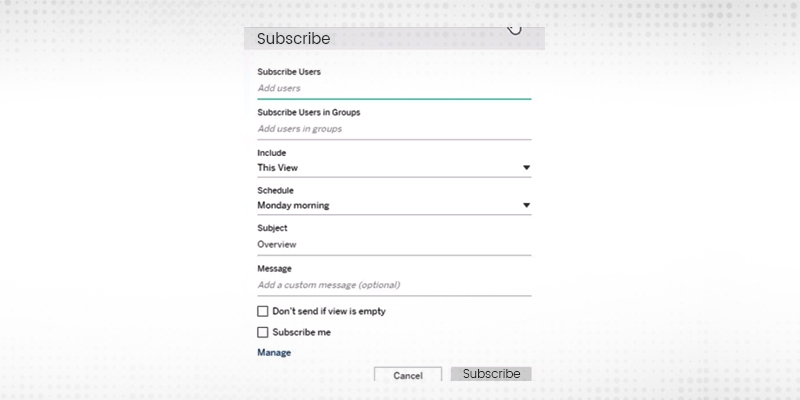
You can also set the frequency like when you want to receive the email and you can skip weekends as well. Subscription can be a great help to the business users who don't want to come to the tableau server every now and then but want to get updated with what is happening recently. For example, you wish to receive an email id update of the sales dashboard. In this situation, you can subscribe to the dashboard and can get a daily or regular alert in your email box. This way, you can have the numbers with you all day and whenever required you can just click on the report and you will be redirected to the live dashboard where you can find the refresh data.
Tableau Online Training & Certification

This was all about how to interact with the content on the tableau server or tableau online. Being a business user it's very important to understand the different kinds of features those we have available on the tableau server and how to use those features for the best of the use. If you are a business user, try around these features and let us know if you are finding any difficulty.
Read: How to create a parameter and use it?
 Pinterest
 Email
Email
The JanBask Training Team includes certified professionals and expert writers dedicated to helping learners navigate their career journeys in QA, Cybersecurity, Salesforce, and more. Each article is carefully researched and reviewed to ensure quality and relevance.

Cyber Security

QA

Salesforce

Business Analyst

MS SQL Server

Data Science

DevOps

Hadoop

Python

Artificial Intelligence

Machine Learning

Tableau
Search Posts
Related Posts
Receive Latest Materials and Offers on Tableau Course
Interviews