Feb 20, 2020
  6.3k
6.3k

19
JunMonth End Offerl : Get 30% OFF + $999 Study Material FREE - SCHEDULE CALL
- Tableau Blogs -
In this article, we are going to talk about the Hierarchies in tableau. The hierarchy in the tableau can be very helpful while creating the tabular report. We will also see what the default hierarchies have available in tableau and how to create a new hierarchy. We will also see how to use that hierarchy in the report.
The hierarchy in Tableau is like a database model where the data is organized in the tree-like structure. At the backend, the whole data will be stored like in individual records which will be connected through each other using links.
You might have found in a tableau that whenever you use any date dimension, it gets converted automatically into some tree-based structure. For example, if you will use the order date from the sample superstore data set into the report view then you will find year by default getting displayed. Although, in order date dimension we have individual dates when the order has been placed. But when we use that field into the report view, the default view that we see in the year of the order date and not the individual date.
So, that creates something like hierarchy. Further, when you click on that year, you will see month then date and so on.

The plus icon that you are saying with the order date says there are more items in this hierarchy. If you will further click on that plus icon you will find that year along with the quarter. Now if you will further click on the plus icon along with the quarter, you will find now three dimensions being displayed there-year, quarter, and month. If you will further click on the plus icon with the month, you will find the day displayed over there. And the view will look like below -
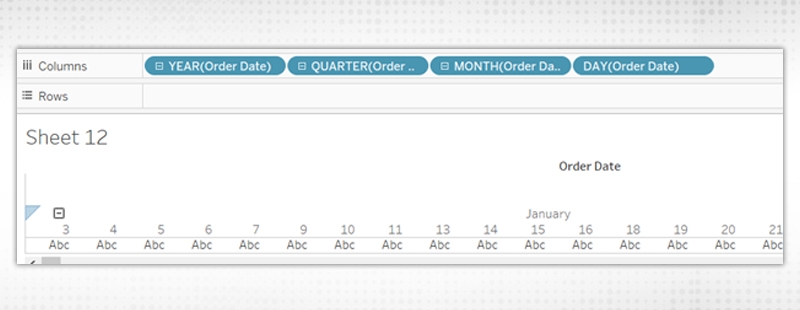
Now as you can see, we don't have any plus icon with any of the dimensions. That's because we don't have any further drill down to this order date dimension. But now we can see some minus icons with year, quarter, and month. If you click on those minus icons, those will be taken in getting into the default view.
So, depending upon the view you are looking for in the report you can play around the hierarchy. This is the default hierarchy that I will create based on the data given. If required we can also create our own hierarchy to be used in the report.
Read: A Guide to Dashboard Interaction in Tableau
There may be multiple requirements when we need to use hierarchies in tableau report to make the report simpler and meaningful. For example, let’s create a report for a different group of users. These groups may be having individual members, project leads, managers, directors and so on.
We have this report for employee-related information. So, when a director will see the report, they might not be interested to see the demographic details of the employee. While when the manager will see the report, they might be interested to see the demographic related details of the employee as well.
As we have to create a single report for all these different groups of users and so show the report should be in a way to address all sets of users. Whenever we have these kinds of requirements hierarchies in the tableau can be very helpful. Here what we can do is, we can create a hierarchy for the demographic details which can contain the name of the customer, city, state, and other details. By default, we can simply show the name of the customer and if the viewers want, they can further click on the plus icon and see for the details of customer. In next section, we are going to see how we can create our own hierarchy in tableau.
To create a hierarchy in tableau, follow the below steps-
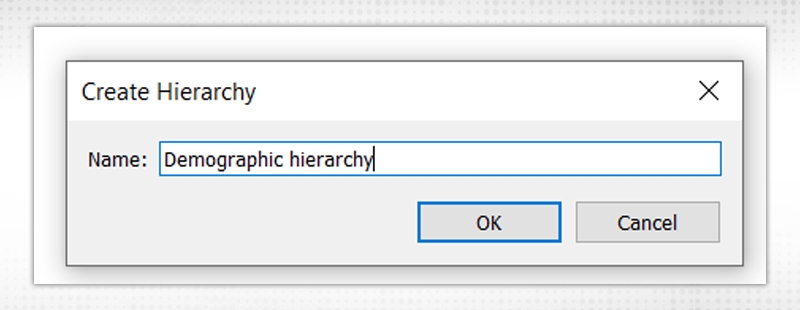

You can also see a tree-like icon along with a variety that denotes that this is a hierarchy and there will be multiple members around it.
Now we need to add a few more dimensions in this hierarchy. The dimensions that we are going to add in this hierarchy are - City, state, and country. Add a new dimension to the created hierarchy, right-click on the dimension select hierarchy, add to hierarchy, and then select the name of the hierarchy in which you want to add that dimension.
You may also drag that dimension and simply put that into the hierarchy field. Both the steps work for a similar purpose. Once you will add city, state, and country, to the demographic hierarchy, your hierarchy will look like below -
Read: How to Interact with the Content on the Tableau Server?

As you can see, we have four members in the demographic hierarchy. As per the property of the hierarchy, the first member of the hierarchy will be shown in the default view. And when the user will click on the plus icon of the first member of the hierarchy the 2nd dimension of the hierarchy will get open. Similarly, when the user will click on the plus icon of the second member of the hierarchy, the third member of the hierarchy will get open. And this process will continue until the last member of the hierarchy will be reached. Once, the last member of the hierarchy will be reached, no more plus icon will be there. But you will find the minus icons with the earlier members of the hierarchy. This way you can create a tabular report with hierarchy.
In the next section, we are going to use the demographic hierarchy that we have just now created into the tabular report.
Tableau Online Training & Certification

We have already created the hierarchy with the name demographic hierarchy and now we are going to use that hierarchy into the tabular report. To use demographic hierarchy, just drag that into the row shelf. Whenever we create a tabular report, mostly we put us dimensions and measures into the row shelf.
Now let's say, we need to show how much sales we have made from each customer. So, we will drag the sum of sales into the row shelf and convert the continuous value of the sales into the discrete value.

Now we have the tabular report with the hierarchy and sales created. As you can see the default view of the demographic hierarchy is the customer name. That's just because we have put customer names in the first place in the hierarchy. Also, the plus icon is being shown with the customer name. So, if you click on the Plus icon, the name of the city will be shown to you also along with the plus icon. Further clicking on the plus icon with the city you will see state names. If you will further click on the plus icon of the state names, the country names will be also shown to you. Now as we don't have any further element of the hierarchy after country, so no longer plus icon will be shown to you. And the view will look like below-
Read: A Complete Guide On Dual Axis

That's how we use hierarchy into the tabular report!
Now depending upon the view, you want the user to default see keep that view and publish the report to the tableau server. That will be the default view any user will be able to see. Further, if the user wants, they can collapse the view or see the detailed view.
It's not always necessary to create only the tabular report with hierarchy. You may create any kind of report and use the hierarchies in that report. It will work in a similar way.
Tableau Online Training & Certification

This was all about the hierarchy in tableau. We discuss what is a hierarchy, why you should create a hierarchy, how to create a hierarchy, and used a hierarchy in the report. This helps us to make a tabular report better and do our work efficiently.
You can also create a hierarchy for your own requirements and then use the same hierarchy to your reporting needs. Also, if you face any difficulty while creating this, you can comment here.
Read: Tableau Data Connection - How to do it right?
 FaceBook
 Twitter
 LinkedIn
 Pinterest
 Email
Email
The JanBask Training Team includes certified professionals and expert writers dedicated to helping learners navigate their career journeys in QA, Cybersecurity, Salesforce, and more. Each article is carefully researched and reviewed to ensure quality and relevance.


Cyber Security

QA

Salesforce

Business Analyst

MS SQL Server

Data Science

DevOps

Hadoop

Python

Artificial Intelligence

Machine Learning

Tableau
Search Posts
Related Posts
A Complete Guide On Dual Axis
 5.5k
5.5k
How to Create & Format Tableau Worksheet?
4.8k
Tableau Career Path: Roles, Skills & Certifications
4.5k
Know Average Tableau Developer Salary for Freshers & Experienced Professionals!
11.5k
Tableau Career Opportunities: What You Need to Know About Tableau in 2025
6.9k
Receive Latest Materials and Offers on Tableau Course
Interviews


 Jan 04, 2022
 5.5k
5.5k