19
JulGrab Deal : Flat 30% off on live classes + 2 free self-paced courses - SCHEDULE CALL
In the previous several blogs, we discussed automating/integrating several aspects of SDLC. We discussed Jenkins configuration, Building and compiling source code, integrated testing with our pipeline, notifications and so on. Now, here’s one more aspect of SDLC, code analysis. For this, we will integrate different tools with our pipeline which will analyse on the basis of the best practice essential for the development of code.
Let’s start analysing code and obviously with the help of both kind of projects:
So, here we proceed !!
Code Analysis tool is to analyse the code for vulnerabilities, bugs, code complexity and test coverage. Code Analysis is basically responsible for code quality which will help in removing duplicated code and reports of code complexity and code coverage also. There are various kinds of code analysis tools present in the market like:
Code analysis done on code without actually executing the code program. Code analysis assists project team(s) in stopping problems before they actually surface. If an organization is not able to identify vulnerabilities at the correct time, it can lead to higher cost, increased maintenance efforts, Business disruption and performance also will be affected
DevOps Training & Certification Course

The Jenkins Next Generation plugin helps in analyzing code, collects all warnings, and helps in visualizing the records through pie charts and graphs. This plugin replaces the entire Jenkins Static Analysis suite. Various other plugins become obsolete now after the launch of this like:
etc

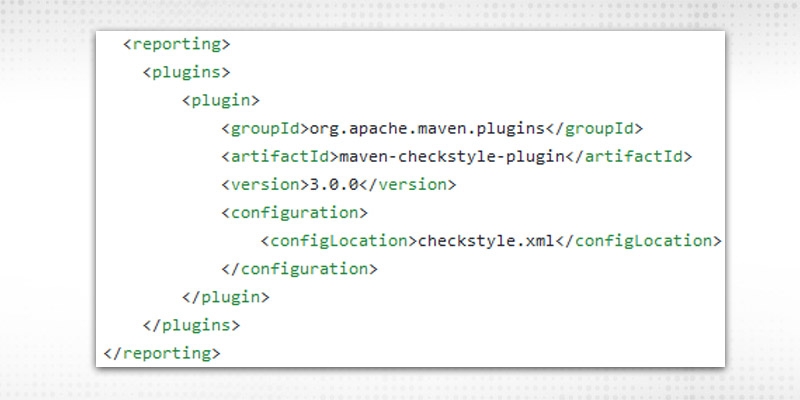
This will enable the reporting of check style results, with a configuration file(required). Put your checkstyle.xml file which is required to have all modules utilized to capture the results, if the developer’s code is following best practice or not.
check style:checkstyle”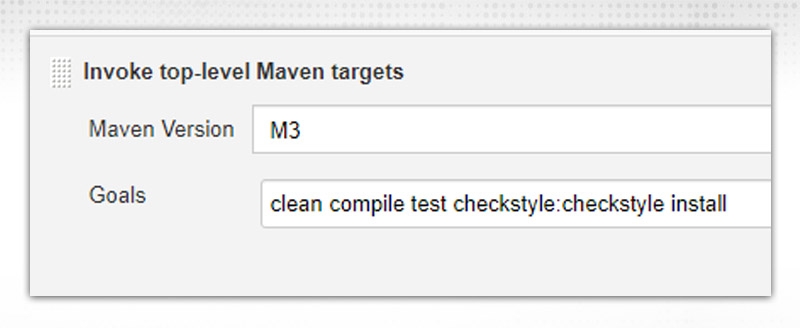
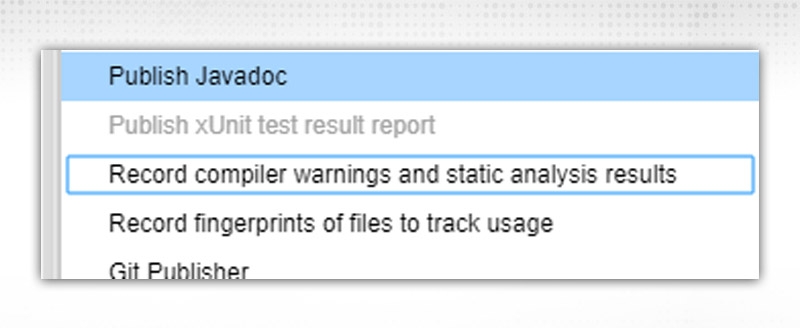
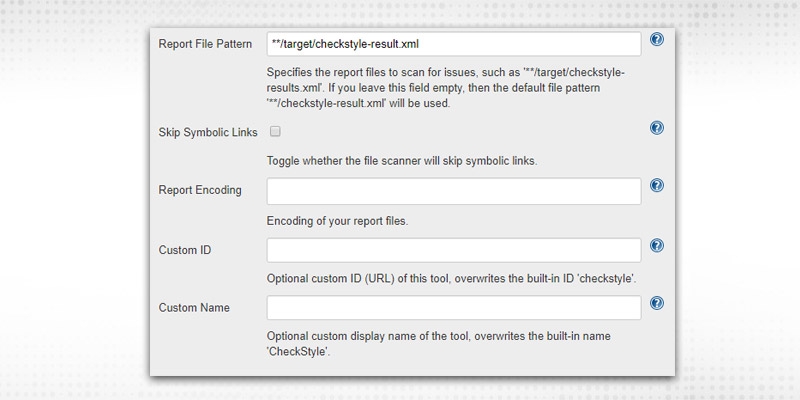
Report File Pattern -- Provide file(s) path from where to generate detailed reports and graphs.
Report Encoding -- whether UTF-8 or ISO-8859-1 etc., I chose the default.
Custom ID - Any unique ID, apart from default “checkstyle"
Custom Name -- Unique Name, apart from default “checkstyle”.
Aggregate results -- To combine end reports of all defined tools
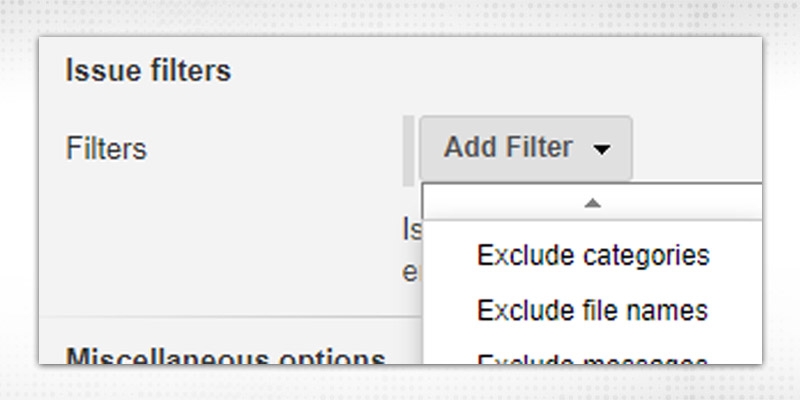
Fail on Errors -- Fails the build, if errors have been reported.
Quality Gate -- Similarly, you can specify a quality gate with threshold value to make build fail/unstable.
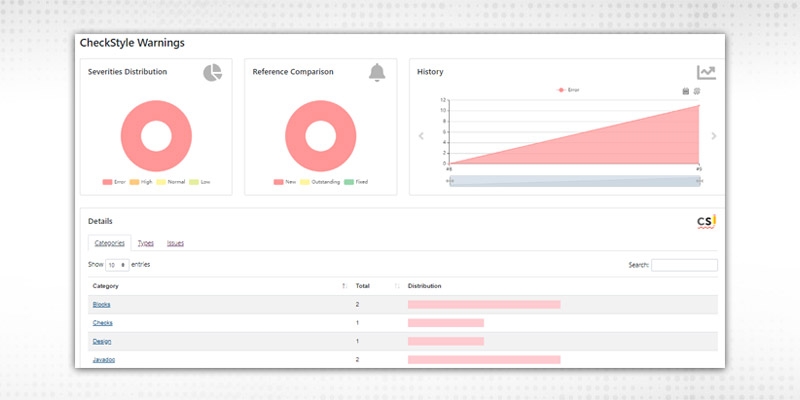
This will give you an overall result in the form of different pie-charts and graphs. In the pie charts, it will show you Severities distribution on the basis of -
In the below, you will see details on the basis of “categories”, “types” and “issues”. Just go through all these to have a better understanding.
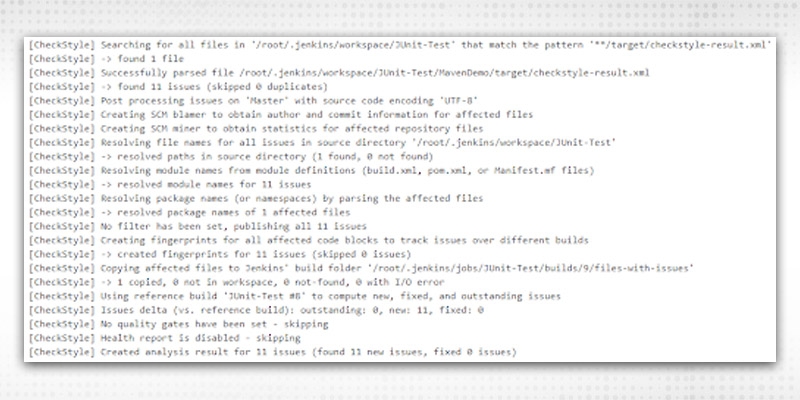
This checkstyle will run on your overall code and try to capture all best practices and vulnerabilities on the ruleset defined in the corresponding xml file( e.g. checkstyle.xml, in this case). Resolve on the basis of priority and severity and proceed. This is how you can integrate your check style warnings in freestyle projects. Graphs will also determine the number of severities fixed from the last run.
On a high level, it will show:
For similar discussions like above, in the pipeline we can use:
To scan and publish static analysis scans and reports. E.g. for scan, following line to be added in “post” block
scanForIssues tool: checkStyle(pattern: '**/target/checkstyle-results.xml')
Sonarqube is the most widely known tool used for static analysis. It will help in catching bugs and vulnerabilities also in your project.
We will use SonarScanner to scan code and will connect to Sonarqube instances. Sonarscanner is available as Jenkins and Maven Plugin.
1. We will use the Community edition of Sonarqube for this blog which comes with its own ES and DB set up. Download latest Sonarqube Community Edition, as a non-root user, start sonarqube server after unzipping the zip file:
/opt/sonarqube/bin/linux-x86-64/sonar.sh console
2. Open URL http://:9000
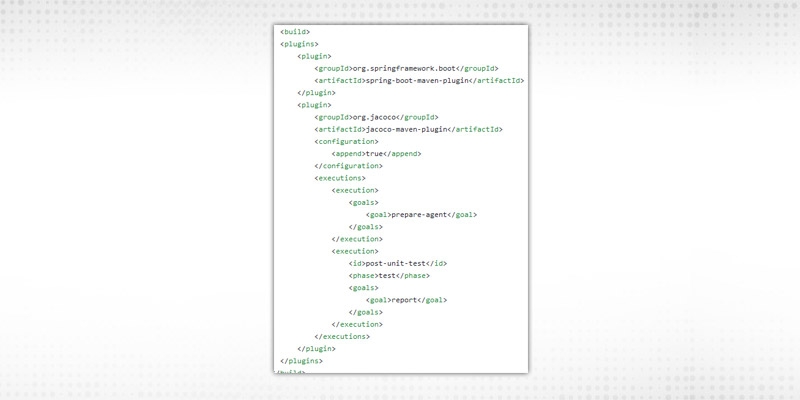
Open your pom.xml and include the following code. We will be using default tool “Jacoco” for code coverage:
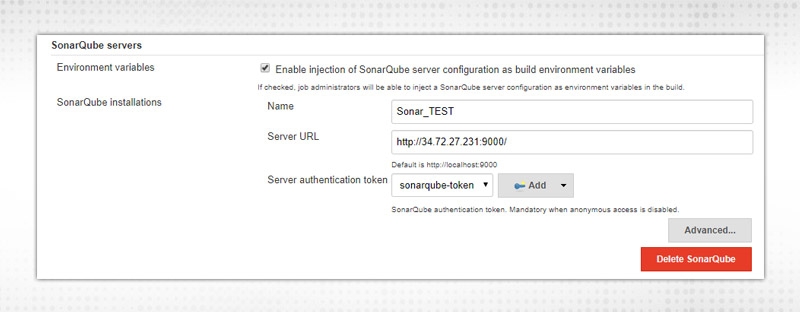
Provide a user-defined name and Server URL. For Server Authentication token, go to your Sonarqube server, click on User at top right, select My Account
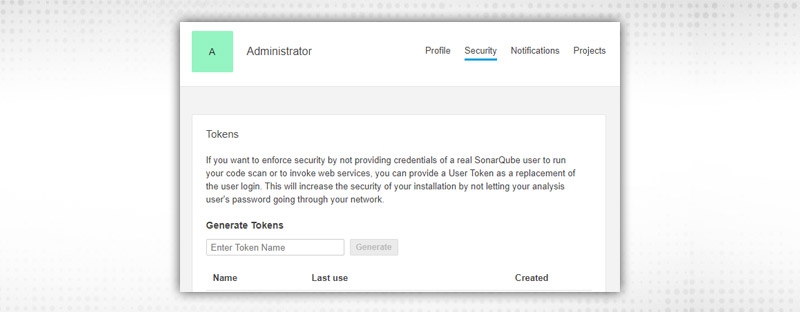
Go to the Security Section, Provide token name under “Generate Tokens” and click Generate. Copy the token and go back to Jenkins. Click on “Add”.
There can be an issue that ADD will not pop up anything, just save the configuration and come back. Click on Add → Jenkins → Select “Secret Text” and add the generated Token there with proper ID(otherwise, it will take a random ID). I provided an ID as “sonarqube-token”.
Click Save.
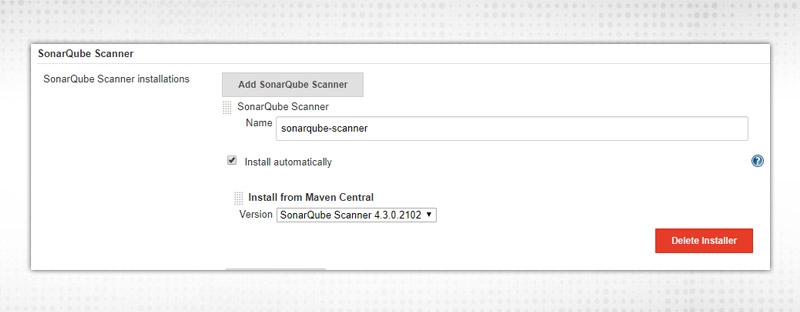
Proceed to Manage Jenkins → Global Tool Configuration → Sonarqube Scanner. Click on Add Sonarqube Scanner
Now, Proceed to Job configuration. Update maven goals section with “verify sonar:sonar install”. Provide sonar host url in Maven properties section:
sonar.host.url=http://
From Build Step, Select “Execute Sonarqube Scanner”
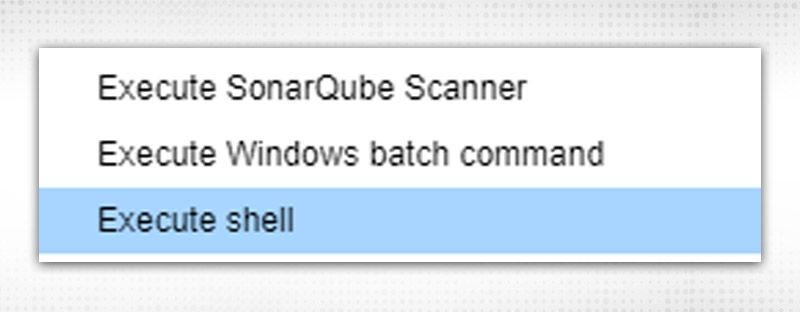
In this section, we will update “Analysis properties” only with following values:
# Metadata Info

sonar.projectKey= //User Declared

sonar.sources=src/main

sonar.sourceEncoding=UTF-8

sonar.language=java
# Tests Configuration

sonar.tests=src/test

sonar.junit.reportsPath=target/surefire-reports

sonar.surefire.reportsPath=target/surefire-reports

sonar.jacoco.reportPath=target/jacoco.exec

sonar.java.binaries=target/classes

sonar.java.coveragePlugin=jacoco
Press Save and Build.
Code will be scanned successfully and you can check from Console output also. Once completed, your Jenkins dashboard will look like:
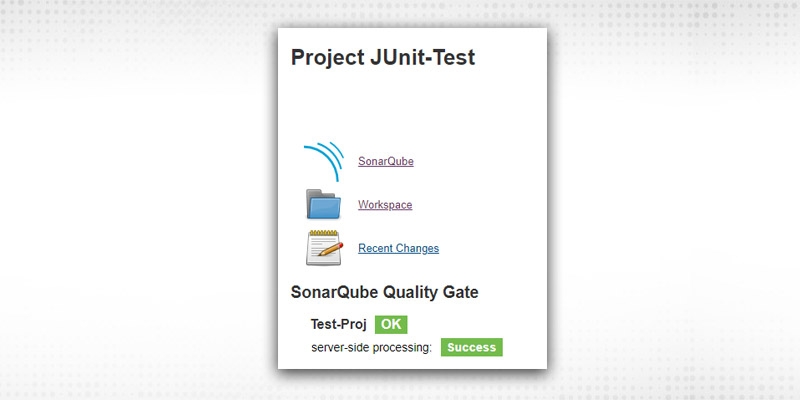
Click on Link from Jenkins, it will open your Sonarqube instance with project key specified in job’s configuration:
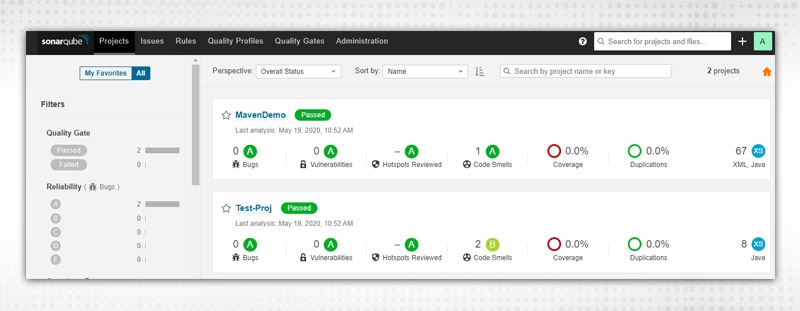
I was having 2 projects running, so it is showing two instances in my case. As it was a sample project, so no coverage happened but there is 1 “code Smells” issue. Similarly, go through your analysis and rectify problems as per priority /severity.
This is how Sonarqube is integrated with Jenkins using the Freestyle project.
Your sample Jenkinsfile will look like:

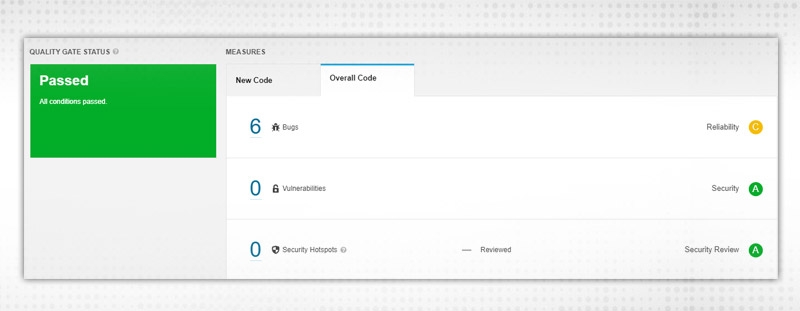
After successful completion, verify your Sonarqube instance:
In this blog, we discussed integrating code analysis tools with Jenkins and how code analysis can help in your project. Happy coding and do let me know if stuck anywhere while trying. In the next blog, we will discuss master-slave architecture in Jenkins, how to manage different nodes for different jobs. See you soon discussing some more interesting stuff on another blog!!
Hope this helps.
 Pinterest
 Email
Email
The JanBask Training Team includes certified professionals and expert writers dedicated to helping learners navigate their career journeys in QA, Cybersecurity, Salesforce, and more. Each article is carefully researched and reviewed to ensure quality and relevance.

Cyber Security

QA

Salesforce

Business Analyst

MS SQL Server

Data Science

DevOps

Hadoop

Python

Artificial Intelligence

Machine Learning

Tableau
Search Posts
Related Posts
What Should You Know About Azure Devops?
![]() 606.5k
606.5k
What is Chef Programming Language? Chef Tutorial Guide for Beginner
![]() 247.7k
247.7k
What is The Relation Between Cloud Computing and DevOps?
![]() 181.9k
181.9k
Puppet Interview Questions and Answers
![]() 519.1k
519.1k
What Is Kubernetes? An Introduction to Container Orchestration Tools
![]() 298.6k
298.6k
Receive Latest Materials and Offers on DevOps Course
Interviews