
 May 09, 2018
  723.8k

29
JunMonth End Offerl : Get 30% OFF + $999 Study Material FREE - SCHEDULE CALL
- DevOps Blogs -
As you browse sites for Nagios, there are only a few websites that have given information on this wonderful monitoring tool. So, I believe that this blog post for “Nagios Tutorial” would be a clear idea of what Nagios is, its configuration, installation, and continuous monitoring with Nagios. The Nagios Monitoring tool keeps a close eye on your entire IT infrastructure, services, business processes, and the servers, etc.
Let us give a quick start to this blog “Nagios Core Tutorial” by discussing the continuous monitoring concept and why we need it. Then we will discuss what is Nagios, Nagios installation & configuration tutorial guide for beginners.
Once the application is deployed to the server, the role of continuous monitoring comes into existence. The process is all about taking care of Company infrastructure and responding immediately as soon as some error occurs. The concept is not new but it is around for a long time.
The technique you must have heard about is the static analysis that is responsible to detect, respond or report the logs but the analysis is not so much accurate as expected by the organizations. With continuous monitoring, you can perform and respond to each of the activities in the best possible way.
When we discuss continuous monitoring, it is necessary that all pieces of information should be connected well like database, warehouse, security tools, security management system, AI (Artificial Intelligence), security intelligence, data analytics, etc. Connecting different pieces together in a well-organized manner is the crux of the process that makes continuous monitoring a more successful and useful requirement by the organizations.
Further, the process is performed on a continuous (on-going) basis that reports immediately about the risks that can be faced by the Company for its poor infrastructure. You can also check the behavior of networks and data analytics reports when required. According to a saying, if you cannot ‘measure’ risks how will you ‘manage’ them and continuous monitoring is the solution that works best here.
Continuous Monitoring has the capability to detect system errors before they could have negative impacts on your business productivity. Here, is a quick list of features that explain to you why continuous monitoring is useful –
Nagios is useful for continuous monitoring of applications, servers, or business processes, etc. inside a DevOps culture. It gives information to the technical staff about any performance issues or drawbacks in the system. When you use Nagios, you don’t have to give much explanation of how an unseen defect in the infrastructure can affect your organizational health badly.
Read: Ansible vs Puppet - What Should You Know?
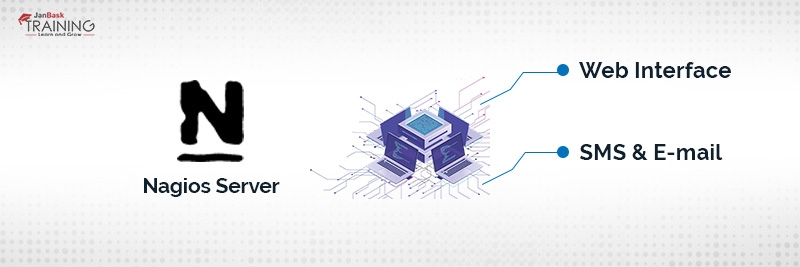
Consider the diagram given above to get a clear idea of Nagios working – Nagios is running on a server where plug-ins are installed and running automatically. They further contact the hosts/servers on your network and give you the status message in two different forms – one is Web Interface and the other is SMS or Email. Further, Nagios Server as shown in the diagram earlier works as a scheduler and runs selected scripts after a repeated time interval. As soon as the requirement changes, the previous scripts will be stored and new scripts will run based on needs. In brief, the working of Nagios is based on Plug-ins that give the confirm status of server, application, or infrastructure issues.
Here are some best reasons why you need Nagios DevOps Tool for your organization.
The foundation of the tool was kept in 1996 that can run under Linux OS.
Here are some considerable benefits of the tool, you should consider before start using it.
It can define or manage event handlers for resolving problems proactively.
Read: Top 20 Git Interview Questions and Answers for 2025
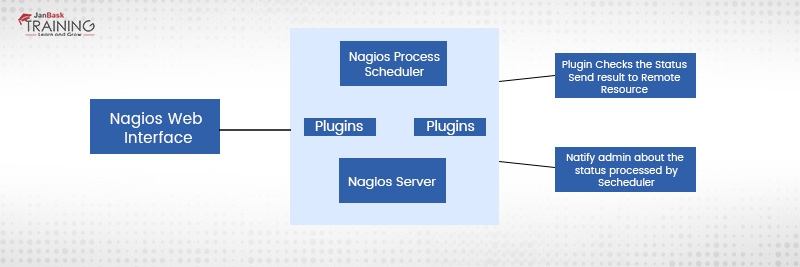
The Nagios platform is based on server-agent architecture. Take an example where Nagios is usually running over a host and plugins are designed to interact with the local network that should be monitored. Further, plug-ins send useful information to the scheduler that will be displayed over GUI.
You also need to understand the working of NRPE – Nagios Remote plug-in Executor. With the NRPE, the plug-ins are executed over local servers or Linux machines. The objective of NRPE is to closely monitor the local resources over a remote resource.
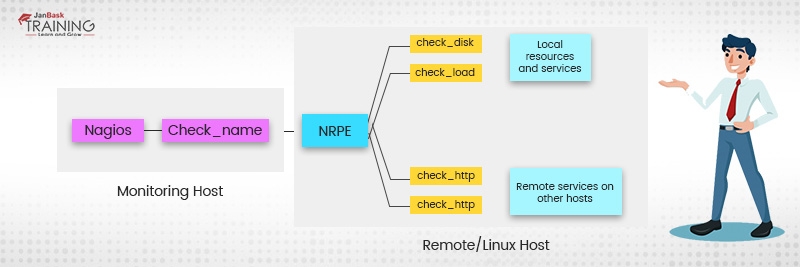
As per the rule, these resources should not be exposed to the external machines. This is the reason why NRPE is needed along with other important components. You can better understand the working of NRPE by looking at the diagram below –
DevOps Training & Certification Course

Let us have some hands-on practice by this quick tutorial i.e. Nagios Installation and Configuration.
Read: Unpack Docker: What It Is, Why It's Popular, and Essential Commands
Visit the URL - http://dl.fedoraproject.org/pub/epel/6/. 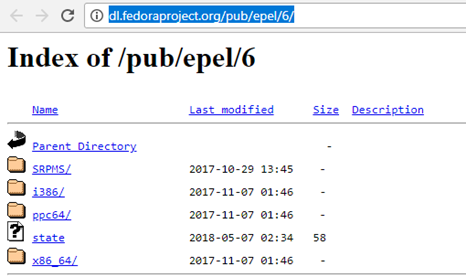 As you soon, you browse the link, the following web page will display in front of you. Here, you can have to click on i386 and you will be redirected to the following page.
 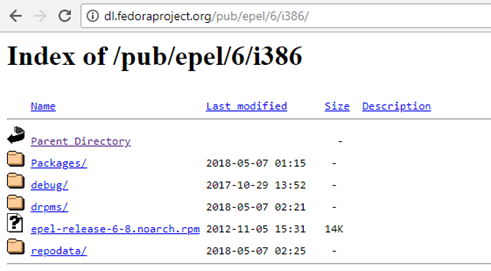 Here you can see the link “epel-release-6-8.noarch.rpm”, now open the terminal and copy the location of the link over the terminal. This is the way you can download the repository on your system. So, you are done with the first step that was pre-requisites. Let us move to the second step now.
Execute the following command on the terminal to install, Nagios plug-ins and NRPE (Nagios Resource Plug-in Executor), Apache and PHP. Apache is needed to monitor the recent web server status and PHP is required to process the dynamic content on your website.  In the next step, you should enable the Apache server with the ‘chkconfig’ command as shown below in the screenshot. And once it is enabled start the Nagios and the Apache server with the ‘service’ command given below.
  Now create the swap file and avail minimum 1 GB space with the ‘dd’ command as given below –
  With the swap file, you can free up the necessary space and shift it somewhere else to the hard drive. You can use the “mkwsap” command to create the swap partitions and prepare the remote host for a swap area. The final command should be written like this as shown below –
 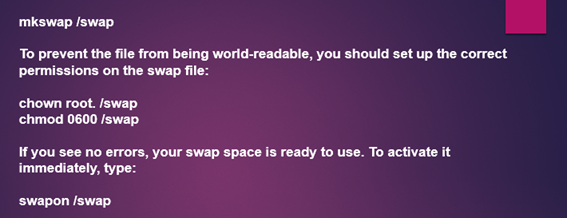 With the above command, only a temporary swap file is created. You can make the swap area permanent by adding it to the fstab file.
  With this command, we are done with the second step. Now let us move to the third step i.e. how to configure Nagios to access the Web interface.
At this step, you need to first set the password for the web interface by typing the following command over the terminal. Retype the password to confirm it. Now open the web browser and type the local hostname in the address bar. Here, you need to enter the username and the password that is just given by you. By default, the username is Nagios admin. You can change the username in the advanced settings option. The password would be the same that we set earlier. In the end, press OK. It will show the Nagios dashboard in front of you as shown below.
 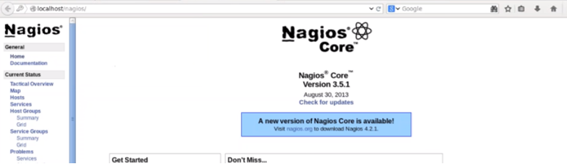 With these steps, you can monitor the localhost only. If you are interested in monitoring the remote host then you need to install the NRPE.
DevOps Training & Certification Course

With this Nagios Tutorial, we got a basic understanding of what is Nagios, about continuous monitoring, Nagios architecture, Nagios setup, installation, and its configuration. I am sure you must have enjoyed reading this blog and got something really new that was needed by you.
To know more about Nagios monitoring tool, you should join the DevOps certification program at JanBask Training and prepare yourself for a better future and wider job opportunities across the global marketplace.
Read: What Is the Difference Between Docker And Vagrant?
 FaceBook
 Twitter
 LinkedIn
 Pinterest
 Email
Email
The JanBask Training Team includes certified professionals and expert writers dedicated to helping learners navigate their career journeys in QA, Cybersecurity, Salesforce, and more. Each article is carefully researched and reviewed to ensure quality and relevance.


Gen AI

Agentic AI

AI in Automation Testing

Cyber Security

Data Science

QA

Salesforce Service Cloud

AWS
Search Posts
Related Posts
Receive Latest Materials and Offers on DevOps Course
Interviews


 Aug 21, 2020
 5.7k
5.7k

 5.7k
5.7k