Machine Learning Interview Questions and Answers for Freshers
The core of AI is machine learning which comprises of different tools and techniques which help in building the fundamental structure of algorithms. Using these algorithms, machines can be automated to perform complex tasks without actually being programmed explicitly.
This fundamental structure of ML and algorithms are the major areas where recruiters look for a candidate’s proficiency. Therefore, to weigh your skills during an interview, we’ve compiled this comprehensive guide on the top 175 Machine Learning questions together with answers for 2025.
Q1). Explain Machine Learning, Artificial learning, and Deep learning in brief.
Ans:- It is very common to get confused between the three in-demand technologies: Machine Learning, Artificial Intelligence, and Deep Learning. These three technologies are different from one another and are interrelated to each other.
While Deep Learning is a subset of Machine Learning, and Machine Learning is a subset of Artificial Intelligence which you can clearly understand in the below-mentioned image. Since some terms and techniques may overlap with each other while dealing with these technologies, it is easy to get confused between them. You can get your AI career started with our artificial intelligence course online.

Therefore, let’s go through these technologies in detail so that you will be able to differentiate between them:
- Machine Learning: Machine Learning includes multiple statistical and Deep Learning techniques that allow machines to use their past exposures and get better at performing particular tasks without being monitored.
- Artificial Intelligence: Artificial Intelligence uses multiple Machine Learning and Deep Learning techniques that enable computer systems to perform tasks using human intelligence, with logic and rules.
- Deep Learning: Deep Learning consists of multiple machine learning algorithms that enable software to learn from itself and perform multiple business tasks, including image and speech recognition. Moreover, it is possible when the systems expose their multi-layered neural networks to large volumes of data for learning.
Q2). What is Bias Error in a machine learning algorithm?
Ans:- Bias is a common error in the machine learning algorithm due to simplistic assumptions. It may undermine your data and does not allow you to achieve maximum accuracy. Further generalizing the knowledge from the training set to the test sets would be difficult for you.
Q3). What do you understand about Variance Error in machine learning algorithms?
Ans:- Variance error is common in machine learning when the algorithm is highly complex and difficult to understand. It may lead to a high degree of variation in your training data leading the model to overfit the data. Also, there could be so much noise in the training data that it is unnecessary in the test data.
Q4). What is the bias-variance trade-off?
Ans:- The bias-variance trade-off can handle the learning errors effectively and manages noise, too, that happens due to underlying data. Essentially, this trade-off will make the model more complex than usual, but errors are reduced optimally.
Q5). How will you differentiate supervised and unsupervised machine learning?
Ans:- Here is the difference between supervised and unsupervised machine learning that you can consider before going on a Machine Learning Interview:
- Supervised learning: Algorithms of supervised learning use labeled data to get trained, and the models take direct feedback to confirm whether the output is correct. Moreover, both the input and output data are provided to the model, and the main aim here is to train the model efficiently to predict the output when it receives new data. However, it can largely be divided into two parts, classification and regression, which help a person to offer accurate results.
- Unsupervised learning: Unsupervised learning algorithms use unlabeled data for training purposes. In this, the models do not take any feedback, unlike supervised learning. However, these models identify hidden data trends from the models. The unsupervised learning model is usually provided with the input data, and its main aim is to identify hidden patterns to extract information from unknown sets of data. It can also be classified into two main parts: clustering and associations. Unfortunately, unsupervised learning offers outcomes that are comparatively less accurate.
Q6). How is the k-nearest algorithm different from the KNN clustering?
Ans:- This is one of the most commonly asked machine learning questions. The K-nearest neighbor algorithm is supervised learning, while the k-means algorithm is assigned under unsupervised learning. While these two techniques look similar initially, there is still a lot of difference between the two. Supervised learning requirements data in the labeled form.
For example, if you wanted to classify the data, you should first label it and then further classify it into different groups. On the other hand, unsupervised does not require any data labeling explicitly. The application of both techniques also depends on project requirements.
Q7). What is ROC (Receiver operating characteristic) Curve? Explain the working of ROC.
Ans:- One of the most commonly asked machine learning questions is to explain the ROC curve.
The Receiver Operating Characteristic curve (or ROC curve) is a fundamental tool used for diagnostic test evaluation and pictorial representation of the contrast between true positive and false positive rates calculated at multiple thresholds. It is used as the proxy to measure the trade-offs and sensitivity of the model. Based on the observation, it will trigger false alarms.
- It shows the tradeoff between sensitivity and specificity (any increase in sensitivity will be accompanied by a decrease in specificity).
- The closer the curve follows the left-hand border and then the top border of the ROC space, the more accurate the test is.
- The closer the curve comes to the 45-degree diagonal of the ROC space, the less accurate the test is.
- The slope of the tangent line at a cut point gives the likelihood ratio (LR) for that test value.
- The area under the curve is a measure of test accuracy.
Q8). What do you mean by precision and recall?
Ans:- The Recall measures true positive rates claimed against the total number of datasets. Precision is the prediction of positive values that your model claims compared to the number of positives it actually claims. It can be taken as a special case of probability as well in the case of mathematics.
Q9). What is the significance of Bayes’ theorem in the context of the machine learning algorithm?
Ans:- With Bayes’ Theorem, you could measure the posterior probability of an event based on your prior knowledge. In mathematical terms, it will tell you the exact positive rate of a condition i.e. divided by the sum of total false rates of the entire population.
Naive Bayes Theorem also known as the Bayes Rule in mathematics and is popular for calculating conditional probability. The name of the theorem was given after a popular mathematician Thomas Bayes. Bayes' theorem's two most significant applications in Machine Learning are Bayesian optimization and Bayesian belief networks. This theorem is also considered the foundation behind the Machine Learning brand, including the Naive Bayes classifier.
Q10). What is Naïve Bayes in machine learning?
Ans:- Naïve is the word used to define the things that are virtually impossible in real life. Here, also you require to calculate the conditional probability as the product of individual probabilities of different components.
The Naive Bayes method is a supervised learning algorithm; it is naive since it makes assumptions by applying Bayes’ theorem that all attributes are independent of each other. Bayes’ theorem states the following relationship, given class variable y and dependent vector x1 through xn:
P(yi | x1,..., xn) =P(yi)P(x1,..., xn | yi)(P(x1,..., xn)
Using the naive conditional independence assumption that each xi is independent: of all I, this relationship is simplified to
P(xi | yi, x1, ..., xi-1, xi+1, ...., xn) = P(xi | yi)

Since P(x1,..., xn) is a constant given the input, we can use the following classification rule:

P(yi | x1, ..., xn) = P(y) ni=1P(xi | yi)P(x1,...,xn), and we can also use Maximum A Posteriori (MAP) estimation to estimate P(yi)and P(yi | xi) the former is then the relative frequency of class ‘y’ in the training set.

P(yi | x1,..., xn)  P(yi) ni=1P(xi | yi)

y = arg max P(yi)ni=1P(xi | yi)
The different naive Bayes classifiers mainly differ by their assumptions regarding the distribution of P(yi | xi): it can be Bernoulli, binomial, Gaussian, and so on.
Q11). How will you differentiate the L1 and L2 regularization?
Ans:- L2 regularization spreads error among multiple terms, while L! is more specific to binary variables where either 0 or 1 is assigned based on requirements. L1 tends to set a Laplacian prior on terms, while L2 tends to set a Gaussian prior.
Q12). How do you select important variables while working on a data set?
Ans:- There are different ways to select crucial variables from a data set:
- Identify and remove corresponding variables prior to finalizing important variables
- These variables can be selected depending on ‘p’ values from Linear Regression
- Forward, Backward, and Stepwise selection
- Lasso Regression
- Random Forest and plot variable chart
- Major features could be chosen depending on the information obtained for the available feature set.
Q13). What are the different types of Learning/ Training models in ML?
Ans:- Machine learning algorithms can be basically classified based on the presence or absence of target variables into the following types.
A. Supervised learning: [where the “Target” is present]
The machine understands with the help of labeled data. This model is trained based on the existing data set before it begins to make decisions with the latest or new data.
The target variable is
Continuous: Linear Regression, polynomial Regression, and quadratic Regression. Refer to the regression testing tutorial to learn more about when making changes to the code and testing and whether it results in any negative effects on other parts of the software application.
The target variable is
Categorical: Logistic regression, Naive Bayes, KNN, SVM (Support vector machine), Decision Tree, Gradient Boosting, ADA boosting, Bagging, Random forest, etc.
B. Unsupervised learning: [where the “Target” is absent]
The machine learns based on unlabelled data without proper guidance. It figures out patterns and relationships in the data by developing clusters automatically. The model is trained through observations and deduced structures present in the data, Principal component Analysis, Factor analysis, Singular Value Decomposition, etc.
C. Reinforcement Learning:
The model is trained using a trial-and-error approach, which involves an agent interacting with the environment to develop actions and then identifying errors or rewards related to that particular action.
Q14). Till now, there have been a number of ML algorithms. How can you determine which algorithm to use if given a data set?
Ans:- ML algorithms to be utilized purely depend on the kind of data in the supplied dataset. If the given data is linear, use linear regression. If the given dataset indicates non-linearity, the bagging algorithm will be better.
If the given dataset must be analyzed or interpreted for some type of business purpose, then use data mining decision trees or SVM. if the given dataset contains images, videos, and audio, in that case, neural networks will be valuable in finding the solution precisely.
Thus, there’s no specific metric to decide which ML algorithm to be utilized for the given dataset. You need to investigate the data with the help of Exploratory Data Analysis, i.e., EDA, and try to comprehend the purpose of making use of the dataset to devise the most fitting algorithm.
Q15). Explain Correlation and Covariance.
Ans:- Correlation is used for measuring and also for evaluating the quantitative relationship between two variables. Correlation measures the relationship between variables such as Income and expenditure, etc.
Moreover, Covariance is a simple way to measure the correlation between two variables, but there is a problem with covariance that they are hard to compare without normalization.
Q16). State the differences between causality and correlation.
Ans:- Causality refers to situations where one action, let’s say, X, leads to an outcome, let’s say, Y; on the contrary, Correlation is only relating one action, i.e., X, to another, i.e., Y, but doesn’t necessarily cause Y.
Q17). You must have looked at ML software almost all the time. How do you apply Machine Learning to Hardware?
Ans:- You need to develop machine learning algorithms in System Verilog, that is a Hardware Development Language. After that, program it out upon an FPGA to implement ML to hardware.
Machine Learning Interview Questions and Answers Related to Deep Learning
Deep learning is an integral part of ML, which works in association with neural networks. It consists of a hierarchical network structure that creates a process to support machines in learning the human thinking behind any action.
We’ve shortlisted the most frequently asked deep-learning interview questions to help you better prepare for your next interview.
Q18). When does regularization come into play in Machine Learning?
Ans:- Sometimes when the ML model starts to reduce in its abilities or overfit, putting it right is essential. It's a regression that redirects or standardizes the coefficient evaluations to zero. It minimizes flexibility and demoralizes learning in an ML model to prevent the danger of overfitting. The complexities in the model are reduced, and it gets better at anticipating.
Q19). How can you relate standard deviation and variance?
Ans:- Standard deviation applies to data dispersal from the mean; conversely, Variance is the avg. degree to which every point differs from the mean. In other words, the avg. of the entire data points. You can relate both as it's a square root of Variance.
Q20). A data set is given to you, missing values spread along 1 standard deviation from the mean. How much of the data would remain untouched?
Ans:- It is mentioned that the data is spread along 1 standard deviation from the mean, which means it is spread across an avg. therefore, we can assume that it’s a normal distribution. In the normal distribution, approximately 68% of data resides in 1 standard deviation from averages such as mean, mode, or median. This shows that around 32% of the data would remain untouched by the missing values.
Q21). Is a high variance good or bad in data?
Ans:- High variance straightaway means that the data spread is huge, and the function has different data types. Normally, the high variance within a feature is looked upon as not-so-good quality.
Q.23). If your dataset is suffering from high variance, how would you handle it?
Ans:- For the datasets with high variance, you can make use of the bagging algorithm to manage them. This ML algorithm divides the data into subgroups using sampling duplicated from random data. Once the data is divided, random data can be utilized to develop rules with the help of a training algorithm. Additionally, you can make use of a polling method to mix all the forecasted outcomes of the ML model.
Q.22). A data set is given to you about utility fraud detection. You’ve developed a classifier model and achieved a performance score of 98.5%. Is this a good model? If yes, justify. If not, what can you do about it?
Ans:- The data set related to utilities fraud detection isn’t balanced enough, which means it is imbalanced. In this type of data set, the accuracy score can’t be the determining factor of performance because it might just forecast the majority class label accurately; still, in this situation, our point of concern is to forecast the minority label.
But normally, minorities are received as noise and overlooked. Therefore, there’s a more possibility of misclassification of the minority label when compared with the majority label. To determine the model performance regarding imbalanced data sets, you must know how to perform Sensitivity analysis (True Positive Rate) or Specificity (True Negative Rate) to evaluate the class label-wise performance of the ML classification model.
If the performance of the minority class label isn’t so good, you can perform the following:
- Use under-sampling or over-sampling for balancing the data.
- Modify the prediction threshold value.
- Assign weights to labels in such a way that the minority class labels get higher weights.
- Identify anomalies.
Q23). Explain the handling of missing or corrupted values in the given dataset.
Ans:- An easy-to-handle way for missing or corrupted values is to delete corresponding rows or columns. If you’ve lots of rows or columns to delete, then you think of replacing them with a new value.
You can use IsNull() and dropna() functions in Pandas to identify missing values and delete the rows or columns. At the same time, the Fillna() in Pandas changes the wrong values with the random value.
Q24). What is the Time series in Machine Learning?
Ans:- A time series in ML is a sequence of numerical data points in sequential order. It monitors the movement of selected data points over a given period and records them periodically.
It doesn’t need any min or max Time input. Data analysts usually use Time series to evaluate data per their given needs.
Did you know that Harvard business review has rated the data analyst profession as the most sought-after and best choice for the 21st century? If you’re an aspiring data science candidate, refer to this in-depth career guide on how to become a data analyst.
Q25). What is a Box-Cox transformation?
Ans:- Box-cox transformation in ML is a powerful transformation that transmits non-normal dependent variables into normal variables because normality is the common assumption made when utilizing several statistical methods.
The Box-cox transformation has a lambda parameter that, when set to 0, indicates that this transformation is equal to log transformation and is utilized for stabilizing variance and also for normalizing the distribution.
Q26). What are the dissimilarities between stochastic gradient descent (SGD) and gradient descent (GD)?
Ans:- Stochastic gradient descent and Gradient descent are the ML algorithms that identify a set of parameters that would reduce a loss function.
A key difference is that a single training sample is determined for the identified set of parameters in Stochastic Gradient Descent. Whereas in Gradient Descend, entire training samples are calculated for every set of parameters.
Q27). What is the exploding gradient problem while using the backpropagation technique?
Ans:- This is one of the most frequently asked machine learning interview questions.
When a lot of error gradients are collected and result in big changes in the neural network in data science, weights at the time of training are known as the exploding gradient problem.
Q28). Can you mention some pros and cons of decision trees?
Ans:- Some key benefits of decision trees include being easy to interpret, robust to outliers, and requiring comparatively few parameters to tune. On the contrary, their cons is that decision trees are susceptible to overfitting.
Q29). Explain the similarities between Random Forest and Gradient Boosting machines.
Ans:-
Q30). What is a confusion matrix, and why do you need it?
Ans:- A confusion matrix, also referred to as an error matrix, is a table often used for illustrating the performance of a classification deep learning model, in other words, a classifier on a group of test data for which the real values are familiar.
It enables us to envision the performance of deep learning algorithms or models. It also facilitates us to find out the ambiguity effortlessly. A confusion matrix is utilized as a measurement of performance for an ML algorithm or model.
It is also popularly known as a summary of forecasts on the deep learning classification model. The total no. of right and wrong forecasts are summarized using count values and divided using each and every class label. The confusion matrix provides data about the mistakes made using the classifier, including the types of errors a classifier makes.
Q31). What do you mean by Associative Rule Mining (ARM)?
Ans:- Associative Rule Mining i.e. ARM, is a distinct method to identify patterns or trends in data such as features, i.e., dimensions that appear together, and features i.e., dimensions, that are correlated with each.
Associative rule mining is often utilized in market-oriented analysis to identify how often any item set appears in a transaction. These rules need to satisfy min Support and confidence at the same time. This rule creation often consists of 2 different stages:
- A minimum support start is provided to get all frequent item sets in a table.
- A minimum confidence exception is provided to frequent item sets so as to create association rules.
Support is a unit of calculating how frequently an “item set” occurs in a data set. Confidence is a unit of measuring how frequently a specific association rule has been discovered to be true.
Q32). What is Marginalisation? Explain how it works.
Ans:- Marginalization in deep learning is totalizing the possibility of random variable ‘X’, providing a joint probability distribution of ‘X’ with other variables. It is also an application of the law of total probability.
P(X=x) = ∑YP(X=x, Y)
Provided the joint probability p(X=x, Y), you can make use of marginalization to identify P(X=x). Therefore, it is used to identify the distribution of one frequent variable by debilitating random variables.
Q33). Explain the phrase “Curse of Dimensionality”.
Ans:- The Curse of Dimensionality signifies a situation where data has a lot of features. This phrase is utilized for expressing the adversity of utilizing brute force or grid search to improve a function with excessive inputs.
The curse of dimensionality also signifies other problems, such as:
- If you’ve got many features compared to observations, you might have a danger of overfitting your model.
- When you’ve got a lot of features, observations become difficult to cluster. Many dimensions affect each observation inside a dataset to look equidistant from all other observations, and a meaningless cluster could be created.
In such situations, dimensionality reduction in data science methods such as PCA comes to help.
Q34). Explain the Principle Component Analysis.
Ans:- The conception behind Principle Component Analysis is to minimize the dimensionality of the data set by minimizing the total no. of correlated variables. Even though the variation requires to be restored to increase the extent.
The variables are converted into a new set, the Principle Components. These principle Components are the eigenvalues of a covariance matrix and hence are orthographical.
Q35). Why is the rotation of components so important in Principle Component Analysis (PCA)?
Ans:- Rotation in Principle component Analysis is highly significant since it escalates the separation in the variance collected by all the components. That’s why the illustration of components will become easy.
If the components aren't rotated, you’ll require extended components to explain the variance.
Q36). What are outliers? Mention three methods to deal with outliers.
Ans:- A data point far away from similar types of data points is referred to as an outlier. They might appear because of experimental mistakes or variability in measurement. Outliers can be problematic and might mislead a learning process, which ultimately results in prolonged training time, wrong models, and unsatisfactory results. You must know what are outliers and how can you detect or treat them.
Following are the 3 methods to deal with outliers:
- Univariate method – searches for data points possessing extreme values on a single variable
- Multivariate method – searches for weird combinations on all the variables
- Minkowski error – minimizes the contribution of prospective outliers in the learning process
Q37). What is the difference between regularization and normalization?
Ans:-
Q38). Explain the difference between Normalization and Standardization.
Ans:- What is data normalization in scaling, is one of the most commonly asked machine learning interview questions. Two very important methods used for scaling are- Normalization and Standardization. Let’s have a look at the difference between them.
Q39). List the most prominent distribution curves together with scenarios where you’ll use them in an algorithm.
Ans:-
- The most prominent distribution curves are - Bernoulli Distribution, Uniform Distribution, Binomial Distribution, Normal Distribution, Poisson Distribution, and Exponential Distribution.
- Bernoulli Distribution could be used for checking if a team will win a tournament or not, whether a newborn child is either male or female, whether you pass an exam or not, etc.
- Uniform distribution is a probability distribution that holds a fixed probability. For example - Rolling a single dice because it holds a constant number of outcomes.
- Binomial distribution is a probability distribution with just two possible outcomes. The prefix ‘bi’ refers to two or twice. For instance, a coin toss. The result would either be heads or tails.
- Normal distribution explains how the values of a variable are distributed. It is mostly a symmetric distribution where a majority of the observations cluster around the central peak. The values far away from the mean fade equally in both directions. For instance - the height of students in a classroom.
- Poisson distribution helps foretell the probability of specific events taking place when you know how frequently those events have occurred. Businessmen could use this distribution to forecast the no. of customers on specific days and let them adjust supply as per the demand.
- Exponential distribution is anxious about the amount of time until a particular event takes place. For instance, how long a car battery will last, in months.
Q40). How do you check the normality of a data set or a feature?
Ans:- Apparently, you can check the normality of a data set or a feature by using plots. Here’s a list of Normality checks:
- Shapiro-Wilk W Test
- Anderson-Darling Test
- Martinez-Iglewicz Test
- Kolmogorov-Smirnov Test
- D’Agostino Skewness Test
Q41). What is Linear Regression?
Ans:- A linear function could be defined as a Mathematical function on a 2D plane as Y =Mx +C, where ‘Y’ is a dependent variable, ' X’ is Independent Variable, ‘C’ is Intercept, and ‘M’ is the slope. The same can be communicated as ‘Y’ is a Function of ‘X’ or ‘Y’ = F(x).
Here’s a video to help you understand Linear Regression in detail:
https://www.youtube.com/watch?v=u0dinUn9MgYAgainst any given value of ‘X’, you can calculate the value of ‘Y’ with the help of the equation of Line. This relationship between ‘Y’ and ‘X’, with a linear polynomial or a degree of the polynomial as 1, is called Linear Regression.
In Predictive Modeling, LR is presented as Y = Bo + B1x1 + B2x2
The values of ‘B1’ and ‘B2’ evaluate the power of the correlation amongst features and the dependent variable.
For instance:
Stock Value in $ = Intercept + (+/-B1)*(Opening value of Stock) + (+/-B2)*(Previous Day Highest value of Stock)
Q42). Differentiate between regression and classification.
Ans:- Both regression and classification are grouped under the supervised ML. The major difference between them is that the output variable in the regression is numerical or continuous, whereas, in classification, it is categorical or discrete.
For instance: To forecast the specific temperature of a specific place comes under the Regression problem; on the contrary, forecasting whether the day will be Sunny, cloudy, or there’ll be rainy is a problem of classification.
Q43). What is target imbalance? How do you fix it? Given a scenario where you’ve performed target imbalance on data. Which metrics and algorithms do you find suitable to input this data onto?
Ans:- If the target variables are categorical, at the time of clustering high dimensional data together or performing a frequency count, and if you find certain categories are more in no. It's called the target imbalance than other categories by a huge number.
For instance: Assume a target column contains - 0,0,0,1,0,2,0,0,1,1 [0s: 60%, 1: 30%, 2:10%] 0 in the majority. To resolve this, you can carry out up-sampling or down-sampling.
Q44). List all assumptions for data to be met before starting with linear regression.
Ans:- Before getting started with linear regression, the following assumptions are required to be met:
- Linear relationship
- Multivariate normality
- No or little multicollinearity
- No auto-correlation
- Homoscedasticity
Q45). When does the linear regression line stop rotating or find an optimal spot where it is fitted on data?
Ans:- The place where the highest RSquared value is to be found is where the line rests. It indicates the no. of variance captured using the virtual linear regression line with reference to the total variance collected by the dataset.
Q46). Why is logistic regression a type of classification technique and not a regression? Name the function it is derived from.
Ans:- As the target column is categorical, it makes use of linear regression to build an odd function which is wrapped using a log function to utilize regression like a classifier. Therefore, logistic regression is a kind of classification method and not a regression technique, and it’s obtained from cost function.
Q47). What could be the issue when the beta value for a specific variable changes too much in every subset when regression runs on different subsets of the given dataset?
Ans:- Variations within the beta values in each subset indicate that the dataset is diverse. To resolve this issue, you can utilize a distinct model for every dataset’s clustered subsets or a nonparametric model like decision trees.
Q48). What does the term Variance Inflation Factor mean?
Ans:- VIF, i.e., Variation Inflation Factor, is the fraction of the model’s variance to the model’s variance, including a single distinct variable. The Variance Inflation Factor estimates the volume of multi-collinearity in a data set of several regression variables. Here are the parameters considered for checking multicollinearity issues.
VIF = Variance of the model with one independent variable
Q49). Which machine learning algorithm is known as the lazy learner, and why is it called so?
Ans:- KNN machine learning algorithm is known as a lazy learner. Because it does not learn any type of machine-learned values or variables from the data training but extensively evaluates distance each time it wants to classify, therefore remembering the training dataset instead.
NLP or Natural Language Processing Interview Questions
Natural Language Processing or NLP supports machines in analyzing natural languages with the aim of learning them. It brings out information from the data by deploying ML algorithms. Besides learning the fundamentals of NLP, preparing particularly for the interviews is essential.
Let’s explore the top Natural Language Interview Questions and Answers
Q64). How does the SVM algorithm handle self-learning?
Ans:- The SVM algorithm has a learning and expansion rate, which is responsible for this. The rate of learning pays or chastises the vector space for creating all the errors, and the expansion rate copes with identifying the extreme separation area among the classes.
Q65). What are Kernels in SVM? List popular kernels used in SVM and a scenario of their applications.
Ans:- The kernel’s function is to get data as input and convert it into the required format. Some of the most popular Kernels utilized in SVM are RBF, Linear, Sigmoid, Polynomial, Hyperbolic, Laplace, etc.
Q66). What is Kernel Trick in an SVM Algorithm?
Ans:- Kernal Trick in an SVM algorithm is a mathematical function that, when implemented on data points, could identify the classification region between 2 different classes. Depending on the choice of function, whether linear or radical, it completely depends on the distribution of data; you can create a classifier.
Q.67). What are ensemble models? Explain how ensemble techniques yield better learning than traditional classification ML algorithms.
Ans:- An ensemble is a set of models which are utilized together to predict both in regression and classification classes. Ensemble learning supports you in enhancing machine learning outcomes as it joins numerous models together.
For this reason, it facilitates a better predictive performance as compared to only one model. Ensemble models are superior to individual models because they minimize variance, average out biases, and reduce the chances of overfitting.
Q68). What is overfitting and underfitting? Why does the decision tree algorithm often suffer from overfitting problems?
Ans:- Overfitting is a mathematical or satistical model or ML algorithm which captures the noise of the data; on the contrary, underfitting is an ML algorithm or a model that doesn’t fit the data as required and appears as if the algorithm or the model is showing low variance but high bias.
In decision trees, overfitting occurs when the tree is constructed to fit all samples in the learning data set accurately. This generates branches with rigid rules and impacts the precision when forecasting samples that are not a part of the learning set.
Q69). What is an OOB error, and how does it occur?
Ans:- For every bootstrap sample, there’s one-third of the data wasn’t utilised in the development of the decision tree, i.e., the data was outside the sample. This type of data is called out-of-the-bag data. So as to get an unbiased accuracy of the model against the test data, the out-of-bag error is utilised.
This data is passed for every decision tree is passed via that tree, and the results are combined to give out-of-bag errors. The percentage of OOB error is often effective in calculating the error in the testing set and doesn’t need additional cross-validation.
Q70). Why is boosting a more stable algorithm as compared to other ensemble algorithms?
Ans:- Boosting concentrates on errors identified in earlier iterations until they turn obsolete. On the other hand, in bagging, there’s no corrective loop. That’s why boosting is a more stable ML algorithm than the ensemble algorithm.
Q71). How do you handle outliers in the data?
Ans:- Outliers are observations in the data set that is extremely away from other observations in the data set. You can find outliers with the help of different tools and functions such as box lot, scatter plot, Z-score, IQR score, etc., and then manage them depending on the visualization you’ve got.
To manage outliers, you can set limits, utilize transformations to minimize data skewness, and delete outliers if they’re errors.
Q72). List popular cross-validation techniques.
Ans:- Following are the 6 main types of cross-validation techniques:
- K fold
- Stratified k fold
- Leave one out
- Bootstrapping
- Random search cv
- Grid search cv
Q73). Is it possible to test for the probability of improving model accuracy without cross-validation techniques? If yes, please explain.
Ans:- Analyzing the probability of enhancing model accuracy without cross-validation methods is possible. To do this, you need to run the machine learning model for the supposed “n” number of iterations, maintaining accuracy. Record all the accuracies and delete the 5% of low probability values. calculate the left [low] cut-off and right [low] cut-off. Using the remaining 95% trust, you can state that the model could go as low or as high as specified inside the cut-off points.
Q74). Name a popular dimensionality reduction algorithm.
Ans:- The popular dimensionality reduction algorithms include Principle Component Analysis and Factor analysis.
Q75). How can you use a dataset without the target variable in supervised learning algorithms?
Ans:- You can use a dataset without the target variable in supervised learning algorithms by inputting the data set in a clustering algorithm, producing optimal clusters, and labeling the cluster nos. as the new target variable.
Thus, the data set now has separate and target variables, ensuring that the data set is ready to be utilized in supervised learning algorithms.
Q76). List all types of popular recommendation systems. Name and explain two personalized recommendation systems along with their ease of implementation.
Ans:- Types of popular recommendation systems contain - Popularity based recommendation, content-based recommendation, user-based collaborative filter, and item-based recommendation.
Personalized Recommendation systems include- Content-based recommendations, user-based collaborative filters, and item-based recommendations.
User-based collaborative filters and item-based recommendations are highly personalised and easy to manage. Their Similarity matrix could be managed easily using Item-based recommendations.
Q77). How do you deal with sparsity issues in recommendation systems? How do you measure its effectiveness? Explain.
Ans:- In order to generate a prediction matrix, Singular value decomposition could be used. RMSE is the means that support your understanding of how close the prediction matrix is to the real matrix.
Q78). Name and define techniques used to find similarities in the recommendation system.
Ans:- The techniques used to find the similarities between the recommendation systems includes- Pearson correlation and Cosine correlation.
Q79). State the limitations of the Fixed Basis Function.
Ans:- Limitations of the Fixed basis functions are:
- Non-Linear transformations can’t delete overlap between two classes, but they can maximize overlap.
- Usually, it isn’t clear which basis functions best suit the given task. Therefore, learning the basic functions could be helpful compared to using fixed basis functions.
- If you wish to make use of just the fixed ones, you can use a number of them which allows the model to figure out the best suit, but that will result in overfitting the model, thus making it unstable.
Q80). Define and explain the concept of Inductive Bias with some examples.
Ans:- Inductive Bias is a group of assumptions humans utilize to forecast results for given inputs that the machine learning algorithm has not come across yet. When you’re trying to learn ‘Y’ from ‘X’ and the hypothesis space for ‘Y’ is infinite, you must decrease the scope by using your beliefs or assumptions related to the hypothesis space, which is also referred inductive bias. Using these assumptions, you can constrain your hypothesis space and also obtain the ability to increasingly test and enhance the data with the help of hyperparameters. For Example:
- Assume that ‘Y’ differs linearly from ‘X’ when implementing Linear regression.
- Assume that there lies a hyperplane isolating negative and positive examples.
Q81). Explain the term instance-based learning.
Ans:- Instance-Based Learning is a group of procedures for regression and classification which generates a class label prediction depending on the resemblance to its nearest neighbours in the training data set.
This algorithm just gathers all the data and gets a solution when required or asked. Simply put, they’re a group of procedures for resolving new issues depending on the solutions of previously solved problems that resemble the current issue.
Q82). Keeping train and test split criteria in mind, is it good to perform scaling before the split or after the split?
Ans:- Preferably, scaling must be carried out post-train and test split. If the data is closely packed, scaling post or pre-split must not result in too much difference.
Q83). Define precision, recall, and F1 Score.
Confusion Metric could be further explained using the following terms:-
True Positives (TP) – Are the accurately forecasted positive values. It indicates that the value of the actual class is ‘Yes’ and the value of the forecasted class is also ‘Yes’.
True Negatives (TN) – Are the accurately forecasted negative values. It indicates that the value of the actual class is ‘No’ and the value of the predicted class is also ‘No’.
False positives and false negatives are the values that appear when your actual class denies the predicted class.
Recall also referred to as Sensitivity is the ratio of true positive rate (TP), to all the observations in actual class – ‘Yes’
Recall = TP/(TP+FN)
Precision is the ratio of positive predictive value, which calculates the amount of precise positives model predicted versus the no. of positives it asserts.
Precision = TP/(TP+FP)
Accuracy is the most intuitive performance means of measure and it is just a ratio of accurately predicted observations to the total observations.
Accuracy = (TP+TN)/(TP+FP+FN+TN)
F1 Score is the weighted average of Precision and Recall. Therefore, this score takes both false positives and false negatives into account.
Q84). Plot validation and training scores with data set size on the x-axis and another plot with model complexity on the x-axis.
Ans:- For high prepossessions in the machine learning models, the model’s performance on the validation data set is the same as the performance on the training dataset. For higher variance in the models, the model’s performance on the validation data set is worse than the performance on the training set.
Q85). What is Bayes’ Theorem?
Ans:- Bayes’ Theorem explains the probability of an event depending on the earlier knowledge of the conditions that could be associated with the event.
Q86). What is Naive Bayes? Why is it Naive?
Ans:- Naive Bayes classifiers are a sequence of classification algorithms that are based on the Bayes theorem. The family of this algorithm shares a common principle that manages each pair of features separately when being classified.
This algorithm is considered Naive because its class attributes are independent of others in the same class. This lack of dependence among two attributes of a similar class develops the quality of naiveness.
Q87). Explain how a Naive Bayes Classifier works.
Ans:- Naive Bayes classifiers are a family of algorithms that are obtained from the Bayes theorem of probability. It works based on the fundamental assumption that each group of 2 features that are being classified is independent of each other, and each feature creates an equal and independent contribution to the result.
Q88). What do the terms prior probability and marginal likelihood mean in the context of Naive Bayes theorem?
Ans:- Prior probabilities are the percentage of dependent binary variables within a dataset. If a data set is given to you and the dependent variable is either 1 or 0, and the percentage of 1 is 60% whereas the percentage of 0 is 30%, then the probability that any new input values for that variable are 1 will be 60%.
The denominator in the Bayes equation is Marginal likelihood, and it ensures that the posterior probability is verified by changing its area 1.
Q89). What’s the difference between probability and likelihood?
Ans:- Probability is the measure of the likelihood that an event will take place, i.e., what is the probability that a particular event will take place? On the other hand, a likelihood function is a function of parameters inside the parameter space, which explains the certainty of getting the observed data.
Therefore, the basic difference is that Probability relates to prospective results; whereas likelihood is related to the hypotheses.
Q90). Why would you Prune your tree?
Ans:- Decision Trees are susceptible to overfitting, and pruning a decision tree helps to decrease its size and reduce the chances of overfitting. A pruning decision tree consists of turning branches of a tree into leaf nodes and deleting the leaf nodes from the original branch. It acts as a tool to carry out the tradeoff.
Q91). Model accuracy or Model performance: which one will you prefer and why?
Ans:- It is a tricky machine learning interview question; you must first get a clear idea of what is Model Performance. If Performance refers to speed, then it is based on the application's nature, and any application attached to the actual-time scenario would require high speed like a crucial function.
In case, Performance is hinting at why accuracy is a highly important virtue - for any kind of imbalance dataset, then accuracy would be an F1 score that will describe the business case. If the data is imbalanced, then Precision and Recall would be more vital than others.
Q92). List the advantages and disadvantages of the Temporal Difference Learning Method.
Ans:- This learning method is a combination of Monte Carlo and Dynamic programming methods. A few of the benefits of this method include
- Learning at every stage, online or offline.
- Learning from a series that isn’t complete.
- Working in continuous environments.
- Lowering the variance compared to the MC method is more effective than the MC method.
Disadvantages include
- Biased estimation.
- More sensitive to initialization.
Q93). How would you handle an imbalanced dataset?
Ans:- Sampling Techniques can be helpful in handling an imbalanced dataset. There are 2 methods to carry out sampling - Under Sample or Over Sampling.
There are other techniques as well –
- Cluster-Based Oversampling and
- Synthetic Minority Over-sampling Technique (SMOTE)
Q94). Mention some of the EDA Techniques.
Ans:- Some EDA techniques include
Visualization
- Univariate visualization,
- Bivariate visualization,
- Multivariate visualization.
- Missing Value Treatment – which replaces missing values with Either Mean or Median
- Outlier Detection – Uses Boxplot to find out the distribution of Outliers and then deploys IQR to set the limit for IQR
- Transformation – Depending on the distribution, deploys a transformation on the features
- Scaling the Dataset – Applies MinMax, Standard Scaler or Z Score Scaling techniques to upgrade the data.
- Feature Engineering – This is the need of the domain and SME knowledge supp[orts Analysts to find derivative fields which can collect more information related to the nature of the data
- Dimensionality reduction — It supports decreasing the volume of data without losing too much information
Q95). Mention why feature engineering is important in model building and list some of the techniques used for feature engineering.
Ans:- Feature engineering mainly has two goals:
- Develop a suitable input dataset to be compatible with the ML algorithm elements.
- Improves the performance of ML models.
Some techniques utilized for feature engineering include- Imputation, Binning, Outliers Handling, Log transform, grouping operations, One-Hot encoding, Feature split, Scaling, and Extracting date.
Q96). Differentiate between Statistical Modeling and Machine Learning?
Ans:- ML models are related to preparing accurate predictions regarding the situations such as Foot Fall in restaurants, etc. On the other hand, Statistical models are developed for assumptions related to the relationship between variables, like what increases sales in a restaurant - is it food or the ambiance?
Q97). Differentiate between Boosting and Bagging?
Ans:- Both Bagging and Boosting are variations of Ensemble Techniques.
Bagging or Bootstrap Aggregation is a technique that is utilized to minimize the variance for ML algorithms possessing very high variance. Decision trees are a specific family of classifiers prone to higher bias.
Bagging is used where several decision trees are created and trained on samples of the actual data, and the outcome is the avg. of all of these separate models.
Boosting is the method of utilizing an n-weak classifier system for prediction like; each weak classifier reimburses for the vulnerabilities or shortnesses of its classifiers. A weak classifier means one which works poorly on the given data set.
It proves that boosting isn’t an algorithm but a technique. Poorly performing classifiers utilized are usually logistic regression or shallow decision trees.
Several algorithms use boosting processes, but 2 are majorly utilized - Adaboost, Gradient Boosting, and XGBoost.
Q98). What is the significance of Gamma and Regularization in SVM?
Ans:- The Gamma in SVM states influence. The lower value stands for ‘far’, and the higher value stands for ‘close’. If Gamma in the SVM is too big, the radius of the area of influence of the support vector contains just the support vector by itself, and not a single amount of regularization using C would be capable of avoiding overfitting.
If gamma in SVM is too small, the model is severely affected and can’t identify the complexity of the data.
Lambda i.e. the regularization parameter, acts as a degree of significance provided to miss-classifications. This could be utilized to bring in the tradeoff with overfitting.
Q99). Define ROC curve work
Ans:- The visual representation of the comparison between true positive values and the false positive values at different thresholds is called the ROC curve. It is utilized as a proxy for the trade off among true positives and false positives.
Q100). What are the dissimilarities between a generative and discriminative model?
Ans:- A generative model understands the various groups of data. On the contrary, a discriminative model will just absorb the distinction among various groups of data. These types of models work a lot better than the generative models with respect to classificaction activities.
Q101). What are hyperparameters, and how are they different from parameters?
Ans:- A parameter represents a variable that is internal to the model and whose value is calculated using the training data. They’re usually stored as a section of the learned model. For instance, weights or biases.
Whereas a hyperparameter represents a variable that is external to the model and whose value can’t be calculated using the data. They’re usually utilized to calculate model parameters. The parameterization is vulnerable to deployment. For instance, learning rate, and hidden layers.
Q102). What is shattering a set of points? Explain the VC dimension.
Ans:- So as to shatter a provided configuration of points, a classifier should be capable of accurately partitioning the plane for each and every potential assignment of positive and negative for the values, in such a way that positive points are differentiated from negative points. For instance, for a framework of ‘n’ points, there are ’2n’ potential assignments of positive or negative values.
When selecting a classifier, you must consider the kind of data to be classified, and this could be acknowledged as the VC dimension of a classifier. It is described as a multiplicity of the biggest set of points that the classification ML algorithm, i.e., the classifier, could shatter.
To have a VC dimension of minimum ‘n’, a classifier should be capable of shattering one given configuration of n points.
Q103). Explain the difference between a linked list and an array.
Ans:- Arrays and Linked lists are utilized for storing the same linear data. However, here are some of the differences between them as follows.
Q104). What is the meshgrid () method and the contourf () method?
Ans:- The meshgrid ( function in Numpy holds on to 2 arguments as an input : varying x-values in the grid, varying y-values in the grid on the other hand meshgrid requires to be constructed before the contourf() function in Matplotlib is utilized which holds several inputs : x-vaules, y-values, contour line (fitting curve) to be plotted in colours, grid, etc.
Q105). Describe a hash table.
Ans:- A process of finding distinct objects from a set of identical objects is referred to as Hashing. In hashing technique, big keys are ransformed into smaller keys. The hash function values are stored in data structures known as hash table.
Q106). List the advantages and disadvantages of using Neural Networks.
Ans:- Advantages of using Neural Netowrks:
You can store the information on the complete network rather than storing it in a table. Neural networks have the capability to work and provide better accuracy in spite of insufficient information. It has an ability of parallel processing and distributed memory.
Disadvantages of using Neural Networks:
Neural Networks need processors that are suitable for parallel processing. Their inexplicable functioning of the network is also an issue because it decreases the trust in the network in few situations such as when you’ve to represent the issue you’ve noticed to the network. Period of the network is often hiddenn. You just have to know that the learning is completed by examining the error value but it doesn’t provide us with an optimal result.
Q107). You have to train a 12GB dataset using a neural network with a machine which has only 3GB RAM. How will you do it?
Ans:- You can use NumPy array to resolve this issue. Upload all the information or data in an array. In NumPy, arrays have got a special property of mapping the entire dataset without uploading it entirely in the memory. You can send the index of an array, partitioning the data into groups, to obtain the data needed and then send the data into the neural network. But beware of keeping the size of gruops normal.
Machine Learning Coding Interview Questions and Answers
Q108). Write a simple code to binarize data.
Ans:- Binarizing of data means converting data into binary values based on specific threshold. The values that are below the threshold are set to 0 and those above the threshold are set to 1 which is helpful in feature engineering.
from sklearn.preprocessing import Binarizer

import pandas

import numpy

names_list = ['Alaska', 'Pratyush', 'Pierce', 'Sandra', 'Soundarya', 'Meredith', 'Richard', 'Jackson', 'Tom',’Joe’]

data_frame = pandas.read_csv(url, names=names_list)

array = dataframe.values

# Splitting the array into input and output

A = array [: 0:7]

B = array [:7]

binarizer = Binarizer(threshold=0.0). fit(X)

binaryA = binarizer.transform(A)

numpy.set_printoptions(precision=5)

print (binaryA [0:7:])
Machine Learning Using Python Interview Questions
Q109). What is an Array?
Ans:- An array can be defined as a group of related items, stored in an adjoining manner. It is an innate concept since the requirement to partition the same objects together comes in our daily lives. Arrays fulfills the similar requirement.
How are arrays stored in the memory? Arrays take up blocks of data, where every element in an array occupies 1 unit of memory. The size of each unit is based on the type of data being utilized.
For instance, if the data type of elements in an array is an integer, then 4 bytes of data would be utilized to save each and every element. For char. Data type 1 byte will be utilized. It is deployment specific, and the above mentioned units might differ from device to device.
Q110). What are the benefits and drawbacks of using an Array?
Ans:- Advantages of using an Array:
- Random access is allowed
- Saves memory
- Cache-friendly
- Foreseeable compile timing
- Supports in the code reusability
Disadvantages of using an Array:
- Process of insertion and deletion of records is time-consuming even if you obtain the required element immediately using random access. It is because of the fact that the action that the elements are required to be reordered after insertion or deletion of elements.
- If the adjacent blocks of memory aren’t available in the memory, then there’s a burden on the CPU to look for the most optimum continuous location available for the requirement.
Now that you have understood arrays, you must understand them in detail by resolving some interview questions. But, moving ahead, let’s look at the functions that Python as a language offers to arrays, also referred to as lists.
append() – Adds an element at the end of the list.
copy() – Returns a copy of a list.
reverse() – Reverses the elements of the list.
sort() – Sorts the elements in ascending order by default.
Q111). What are Lists in Python?
Ans:- Lists is an efficient data structure provided by Python and it comes with different functionalities. For example, assume that you want to copy a list to another list. If the same task had be performed in C programming, you would need to create your own function to deploy the same.
On the other hand, Python offers you with a function knwon as Copy. you can copy a list to another by calling the copy ().
Q112). Given an array of integers where each element represents the maximum no. of steps that could be made forward from that element. The task is to identify a minimum number of jumps to reach the end of the array (beginning from the first element). If an element is 0, then it can’t move through that element.
Ans:- Here’s the solution:
This issue is popularly known as the end-of-array problem. You wish to evaluate the minimum no. of jumps needed to reach the end. The element in the array indicates the max. no of jumps that that specific element can take.
Let’s understand how to resolve the problem initially.
You want to reach the end. Hence, let’s first count the position that tells us how near we’re to the end. Assume the array A=[1,2,3,1,1]
In the above example, you can start from
> 2 - >3 - > 1 - > 1 - 4 jumps
1 - > 2 - > 1 - > 1 - 3 jumps
1 - > 2 - > 3 - > 1 - 3 jumps
Thus, you must have got the fair idea of the issue. Let’s put forward the logic for the same.
Let’s begin from the end and move backward because it makes more sense impulsively. You’ll have to use variables right and prev_r representing the earlier right to keep up with the no. of the jumps.
In the beginning, right = prev_r = the last but one element. Let’s consider the distance of an element to the end and the no. of jumps that are possible by that element. Therefore, if the sum of the total no. of jumps is possible and the distance is more than the previous element, then you’ll delete the earlier element and make use of the second element’s value to jump. Evaluate it first using a pen and paper first. The logic might look very simple to deploy. Afterward, deploy it on your own and then check with the result.
def min_jmp(arr):

    n = len(arr)

    right = prev_r = n-1

    count = 0

    # We start from rightmost index and travesre array to find the leftmost index

    # from which we can reach index 'right'

    while True:

        for j in (range(prev_r-1,-1,-1)):

            if j + arr[j] >= prev_r:

                right = j

        if prev_r != right:

            prev_r = right

        else:

            break

        count += 1

    return count if right == 0 else -1

# Enter the elements separated by a space

arr = list(map(int, input().split()))

print(min_jmp(n, arr))
Q113). Given a string ‘S’ consisting only of ‘a’s and ‘b’s, print the last index of the ‘b’ present.
Ans:- When you are given a string of a’s and b’s, you can instantly identify the first location of a character appearing. Hence, to identify the last appearance of a character, you reverse the string and find out the first occurrence, which is equal equivalent to the last occurrence in the actual string.
Here, we’re assigned an input as a string. Hence, start by dividing the characters element-wise with the help of the split function. Afterward, reverse the array, find out the first appearance position value, and obtain the index by identifying the value len – position -1, where the position is the index value.
def split(word):

    return [(char) for char in word]

a = input()

a= split(a)

a_rev = a[::-1]

pos = -1

for i in range(len(a_rev)):

    if a_rev[i] == ‘b’:

        pos = len(a_rev)- i -1

        print(pos)

        break

    else:

        continue

if pos==-1:

    print(-1)
Q114). Rotate the elements of an array by d positions to the left, with an example.
Ans:- A = [1,2,3,4,5]
A <<2
[3,4,5,1,2]
A<<3
[4,5,1,2,3]
You can see a pattern here. In other words, the initial, ‘d’ elements are being exchanged with the last n-d +1 elements. Ths, you can just swap the elements. Right? In case, if the size of the array is huge, for example, 10000 elements. There could be chances of memory or run-time errors. Hence, do it more carefully. Now rotate the elements one by one so as to avoid the above errors, in case of huge arrays.
# Rotate all the elements left by 1 position

def rot_left_once ( arr):

n = len( arr)

    tmp = arr [0]

    for i in range ( n-1): #[0,n-2]

        arr[i] = arr[i + 1]

arr[n-1] = tmp

# Use the above function to repeat the process for d times.

def rot_left (arr, d):

    n = len (arr)

    for i in range (d):

        rot_left_once ( arr, n)

arr = list( map( int, input().split()))

rot =int( input())

leftRotate ( arr, rot)

for i in range( len(arr)):

    print( arr[i], end=' ')
Q115). Explain the Water Trapping Problem
Ans:- Provided an array arr[] of ‘n’ non-negative int. Which indicates the height of blocks at index I where the width of every block is 1. Calculate how much water could be collected in blocks after rain.
# Structure is like below:
# | |
# |_|
# The answer is you can trap two units of water.
Solution: Consider you’re given an array where each element represents the block's height. 1 unit of height is equivalent to 1 unit of water, provided space exists among the 2 elements to store it. Therefore, you are required to identify all these types of existing pairs that could store water. You must take care of the potential cases:
- There must be no overlap of water stored
- Water must not overflow
Q116). Explain Eigenvectors and Eigenvalues.
Ans:- Linear transformations are useful in understanding with the help of eigenvectors. They identify their prime use in developing covariance and correlation matrices in data science.
In other words, eigenvectors are navigational elements along with linear transformation features such as compression, flip, etc., which could be implemented.
Eigenvalues result from the linear transformation features across every direction of an Eigenvector.
Q117). How would you define the number of clusters in a clustering algorithm?
Ans:- The number of clusters in the clustering algorithm could be evaluated by identifying the silhouette score. Usually, your aim should be to obtain a few inferences from data with the help of clustering techniques so that you can have an entire perspective of a no. of classes being presented by the data. Here, the silhouette score supports you in evaluating the no. of cluster centers to cluster our data.
The elbow method is another method that can be used.
Q118). What performance metrics can be used to estimate the efficiency of a linear regression model?
Ans:- Following are the performance metric that could be used here:
- Mean Squared Error
- R2 score
- Adjusted R2 score
- Mean Absolute score
Q119) What is the default method of splitting in decision trees?
Ans:- Gini Index is the default method of splitting in decision trees. It is the measure of the impurity of a specific node.
It could be changed by making changes to classifier parameters.
Q120). How is p-value useful?
Ans:- The p-value provides us with the probability that the null hypothesis is true. It also provides us with the statistical importance of our outcomes. Simply put, the p-value evaluates the confidence of a model in a specific result.
Q121). Can logistic regression be used for classes of more than 2?
Ans:- No, logistic regression cannot be utilized for classes greater than 2 because it is a binary classifier. Whereas, for multi-class classification algorithms such as Decision Trees, Naïve Bayes’ Classifiers are appropriate.
Q122). What are the hyperparameters of a logistic regression model?
Ans:- The trainable hyperparameters of a logistic regression model are the Classifier penalty, classifier solver, and classifier C. These hyperparameters could be mentioned mainly using the values in Grid Search to hyper-tune a Logistic Classifier.
Q123). Name a few hyper-parameters of decision trees.
Ans:- The following are the most important features that one can tune in decision trees:
- Splitting criteria
- Min_leaves
- Min_samples
- Max_depth
Q124). How to cope with multicollinearity?
You can deal with Multi-collinearity using the following steps:
- Delete highly similar predictors from the model.
- Make use of PLS (Partial Least Squares) Regression or Principal Components Analysis
Q125). What is Heteroscedasticity?
Ans:- Heteroscedasticity is a situation where the variance of a variable is not equal across the varying values of the predictor variable.
It must be prevented in regression as it presents worthless variance.
Q126). Is the ARIMA model a good fit for every time series problem?
Ans:- No, the ARIMA model is unsuitable for each and every type of time series issue. There are cases where this model and others also turn out to be useful.
The ARIMA model is best when various conventional temporal structures need to be collected for time series data.
Q127). How do you cope with the class imbalance in a classification problem?
Ans:- Class imbalance could be handled using the following methods:
- By using class weights
- By using Sampling
- By using SMOTE
- By selecting loss functions() such as Focal Loss
Q128). What is the role of cross-validation?
Ans:- Cross-validation is a method that is used to maximize the performance of an ML algorithm, in which the machine is given sampled data from similar data for some time. The sampling is performed in order that the dataset is split up into small parts of an equal no. of rows, and an arbitrary part is selected as the test set when all other parts are selected as train sets.
Q129). What is a voting model?
Ans:- A voting model is an ensemble ML model which joins a number of classifiers but, for generating the final output, whereas in the case of a classification-based model, it considers the classification of a specific data point of all the models and selects the most guaranteed option from all the provided classes in the target column.
Q130). How to deal with very few data samples? Is it possible to make a model out of it?
Ans:- You can use oversampling to generate new data points if there are very few data samples. Thus, you can get new data points.
Q131). What are the hyperparameters of an SVM?
Ans:- The hyperparameters of an SVM include gamma value, c value, and kernel type.
Q132). What is Pandas Profiling?
Ans:- Pandas profiling is a step to identify the efficient no. of usable data. It provides us with the statistics of NULL and the usable values and therefore creates variable and data selection for developing models in the initial phase very effectively.
Q133). What impact does correlation have on PCA?
Ans:- When the data is linked, PCA doesn’t work properly. Due to the correlation between variables, the efficient variance of variables minimizes. Therefore, corresponding data, when utilized for PCA, doesn’t work well.
Q134). How is PCA different from LDA?
Ans:- PCA is unsupervised and considers the variance, whereas LDA is supervised and considers the distribution of classes.
Q135). Which different distance metrics could be used in KNN?
The following distance metrics could be used in KNN.
- Manhattan
- Minkowski
- Tanimoto
- Jaccard
- Mahalanobis
Q136). Which metrics could be used to measure the correlation of categorical data?
Ans:- The Chi-square test can be used to do so. It provides the measure of the correlation among the absolute predictors.
Q137). Which algorithm can be used in value imputation in categorical and continuous data categories?
Ans:- KNN is the only one algorithm that could be utilized for the imputation of categorical as well as continuous variables.
Q138). When should ridge regression be preferred over lasso?
Ans:- You must make use of the ridge regression when you wish to utilize all predictors and not remove any since it minimizes the coefficient values but doesn’t abolish them.
Q139). Which algorithms can be used for important variable selection?
Ans:- Different algorithms like Random Forest, Xgboost, and plot variable importance charts could be used for variable selection.
Q140). What ensemble technique is used by Random forests?
Ans:- Bagging is the ensemble method of data mining utilized by Random Forests. Random forests are groups of decision trees that work on sampled data from the actual dataset, along with the final forecast being a voted average of all the decision trees.
Q141). What ensemble technique is used by gradient-boosting trees?
Ans:- Gradient-boosting trees use the “Boosting” technique.
Q142). If you’ve got a high bias error, what does it mean? How to treat it?
Ans:- High bias error refers to the model you’re using and ignores all the crucial trends in the model, and it is underfitting.
To minimize the underfitting:
- You have to maximize the complexity of the model
- No. of features are required to be increased
At times, it also provides an impression that the data is noisy. therefore, the noise from the data must be cut out for the model to identify the most crucial signals and make efficient predictions.
Maximizing the no. of times leads to an increase in the model's training duration. It’s useful in minimizing error.
Q143). Which type of sampling is better for a classification model and why?
Ans:- Stratified sampling is the best for the classification model since it considers the balance of classes in train and test sets. The number of classes is managed, so the model performs well.
Q144). What is a good metric for measuring the level of multicollinearity?
Ans:- VIF or 1/tolerance is the best measure of calculating multicollinearity in models. It is the percentage of the predictor’s variance that stays unaffected by other predictors. Therefore, the bigger the VIF value, the more the multicollinearity between the predictors.
A thumb rule to remember for interpreting the variance inflation factor:
- 1 = not correlated.
- Between 1 and 5 = moderately correlated.
- Greater than 5 = highly correlated.
Q145). When can a definite value be treated as a continuous variable, and what effect does it have?
Ans:- A definitive predictor could be treated as a continuous variable when the nature of the data points it showcases is ordinal numeral. When the predictor variable has ordinal data, it could be treated as continuous, and its inclusion in the model improves its performance.
Q146). What is the role of maximum likelihood estimation in logistic regression?
Ans:- The maximum likelihood estimation in logistic regression helps in estimating the most possible value of the estimator’s predictor variable coefficients, producing a result that is most likely or probably closer to the true values.
Q147). Which distance do we measure in the case of KNN?
Ans:- In the case of the KNN, we measure the hamming distance for the evaluation of nearest neighbors. Kmeans makes use of the Euclidean distance.
Q148). What is a pipeline?
Ans:- A pipeline is a complicated way of writing software in such a way that every intended action when developing a model could be serialized, and the process calls the separate functions for the distinct activities. The activities are performed in series for a given sequence of data points, and the complete process could be executed using composite estimators in sci-kit Learn.
Q149). Which sampling technique is most suitable when working with time-series data?
Ans:- You can make use of custom iterative sampling like when you continuously insert samples in the train set. You must remember that the sample utilized for validation must be inserted in the next train set, and a new sample is utilized for validation.
Q150). What are the benefits of pruning?
The following are the benefits of Pruning:
- Minimizes overfitting
- Minimizes the size of the tree
- Decreases the complexity of the model
- Increases bias
Q151). What is a normal distribution?
Ans:- The distribution which has the following properties is called a normal distribution.
- The mean, mode, and median all are equal.
- The curve is symmetric at the center.
- Precisely half of the values are to the left of the center, and precisely half the values are to the right.
- The entire area under the curve is 1.
Q152). What is the 68 percent rule in normal distribution?
Ans:- In the 68 percent rule, the normal distribution curve is bell-shaped. The majority of the data points surround the median. Therefore, almost 68 percent of the data is around the median. Since there’s no imbalance and it's bell-shaped.
Q153). What is a chi-square test?
Ans:- A chi-square test evaluates whether a sample data matches a population. This test for independence compares 2 variables in a crosstab to find out whether they’re relevant.
A very little chi-square test statistic indicates that observed data fits the intended data fantastically.
Q154). What is a random variable?
Ans:- A Random Variable is a group of potential values from a random experiment. For instance, tossing a coin. You could either get heads or tails.
Q155). What is the degree of freedom?
Ans:- Degree of freedom is the number of independent values or quantities that could be allotted to a statistical distribution. It is utilized in Hypothesis testing as well as chi-square test.
Q156). Which kind of recommendation system is used by Amazon to recommend similar items?
Ans:- Amazon uses a collaborative filtering algorithm to recommend the same types of items. It’s a user-to-user similarity-based mapping of user resemblance and is open to buying.
Q157). What is a false positive?
Ans:- A false positive is a test result that wrongly represents that a specific condition is present.
For example – Stress testing, which is a routine diagnostic tool useful in identifying heart disease, leads to a number of false positives in women.
Q158). What is a false negative?
Ans:- A test result that wrongly represents that a specific condition is absent.
For example – It’s a possibility to have a false negative— when the test says you aren’t pregnant but you are.
Q159). What is the error term composed of in regression?
Ans:- Error term in regression is a sum of bias error+variance error+ irreducible error. Bias and variance errors could be decreased but not the fundamental error.
Q160). Which performance metric is better, R2 or adjusted R2?
Ans:- Adjusted R2 is better than R2 because the performance of predictors affects it. R2 is segregated from predictors and indicates performance improvements via increase if the number of predictors increases.
Q161). What’s the difference between Type I and Type II errors?
Ans:- These two are errors in machine learning which refer to false values. Type I error is the same as a False positive, whereas Type II error is the same as a False negative. A hypothesis in Type I error that should be accepted doesn’t get accepted. Similarly, with Type II errors, the hypothesis gets denied, which should be accepted before anything else.
Q162). What do you understand by L1 and L2 regularization?
Ans:- L1 regularization: Is more binary or sparse, with several variables being allocated a 1 or 0 in weighting. And it corresponds to creating a Laplacean ahead of the terms.
L2 regularization: Tries to transmit errors between all the terms, corresponding to a Gaussian prior.
Q163). Which one is better, Naive Bayes Algorithm or Decision Trees?
Ans:- It is based on the issue that you’re solving. Still, a few general benefits are as follows:
Naive Bayes:
- Works well with a small dataset as compared to DT, which requires more data
- Minor overfitting
- Small in size but quicker in processing
Decision Trees:
- Decision Trees are highly flexible, easy to comprehend, and easy to troubleshoot.
- No initialization or transformation of features is needed.
- Susceptible to overfitting, you can still make use of pruning or Random forests to prevent that.
Q164). What do you mean by the ROC curve?
Ans:- ROC curve, i.e., Receiver Operating Characteristics: demonstrates the diagnostic capabilities of a binary classifier. ROC curve can be calculated or developed by plotting True Positive values against False Positive at different threshold settings.
The performance metric of this curve is the Area Under the Curve i.e., AUC. thus, the more the area under the curve, the better the power of prediction of the model.
Q165). What do you mean by the AUC curve?
Ans:- AUC curve, i.e., Area Under curve, means the higher the area under the curve, the better the prediction power of the model.
Q167). What is log-likelihood in logistic regression?
Ans:- A log-likelihood in logistic regression is the total of the likelihood residuals. At the upper limit, the natural log of the error, i.e., residual, is evaluated for each and every record, multiplied by -1, and then those values are added. This total is then utilized as the base for deviance (2 x ll) and likelihood (exp(ll)).
The log-likelihood values are utilized to compare various models, whereas the deviances, i.e., test, naive, saturated, etc. could be utilized to evaluate the predictive power and accuracy.
Q168). How would you evaluate a logistic regression model?
Ans:- In any type of analysis, Model Evaluation is a very essential part of answering the following questions:
How efficiently the model fits the data? What types of predictors are highly important? Are the forecasts precise?
You can use the following criterion to access the model performance,
- Akaike Information Criteria (AIC): AIC evaluates the relevant amount of information lost by the provided model. Therefore, the less information lost, the better the quality of your model. Thus, you always prefer models with lesser AIC.
- Receiver operating characteristics (ROC curve): ROC curve demonstrates the diagnostic capabilities of a binary classifier. ROC curve is evaluated or developed by plotting True Positive against False Positive at different threshold settings.
- Confusion Matrix: To find out how well a model foresees the target variable, you make use of a confusion matrix or classification rate. It is nothing else but a tabular interpretation of real Vs forecasted values that support you to identify the accuracy of the model.
Q169). What are the advantages of SVM algorithms?
Ans:- SVM algorithms are highly beneficial in terms of complexity. Let’s first clear it that Logistic regression and SVM could develop nonlinear decision surfaces and can be combined with the kernel trick. So, if Logistic regression could be joined with the kernel, then what is the use of SVM?
- SVM provides better performance in most cases, practically.
- SVM is statistically cheaper O(N^2*K) here K is a number of support vectors and logistic regression is O(N^3).
- Classifier in SVM is based just on a subset of points .
Q170). Why does XGBoost perform better than SVM?
Ans:- The major reason of XGBoost performs better than SVM is that XGBoost is an ensemble method that utilizes several decision trees when making a decision therefore it acquires power by repeatiting itself.
SVM is a linear seperator, thus, when data isn’t seperable linearly, SVM requires a Kernel to pass the data into a space where it is possible to seperate it, and this is where its greatest strength and weakness lies, by being capable to pass the data to a higer dimensional space SVM could identify the linear seperation for approximately any type of data but simultaneously it requires to make use of a Kernel and you can maintain that there’s not a accurate kernel for each data set.

 Jan 06, 2025
  115.9k


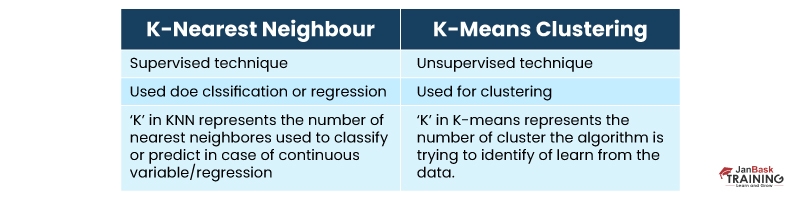
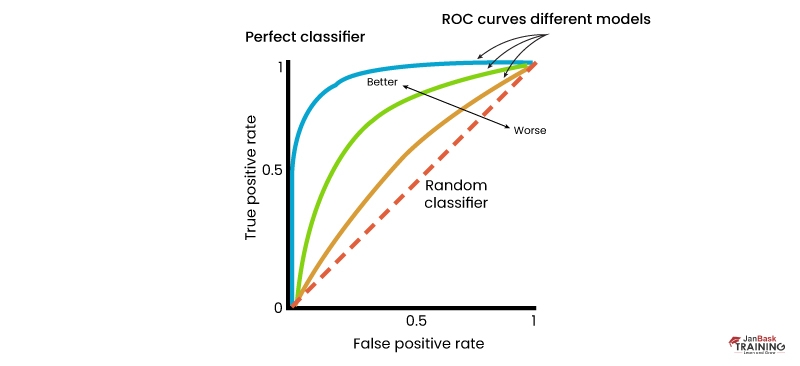

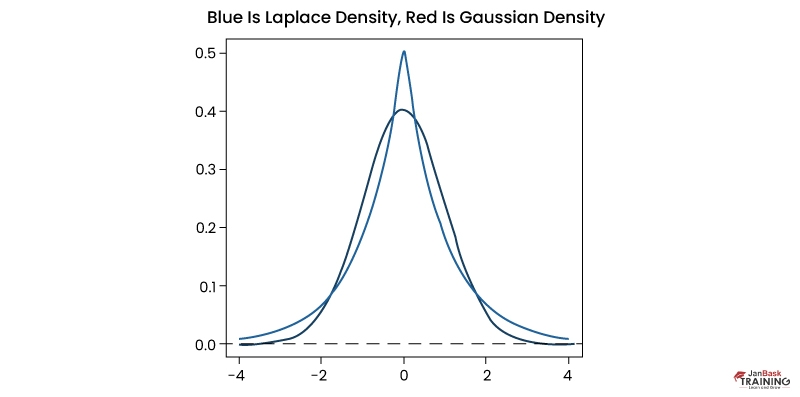
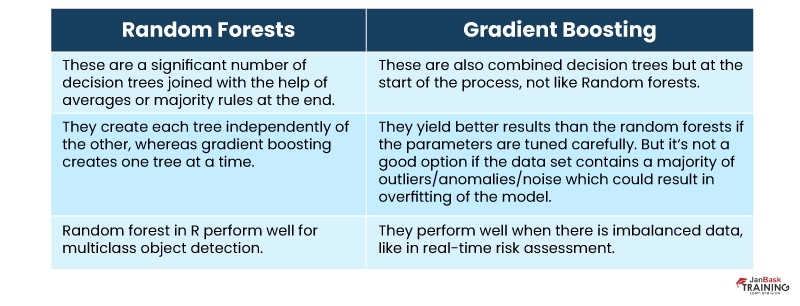
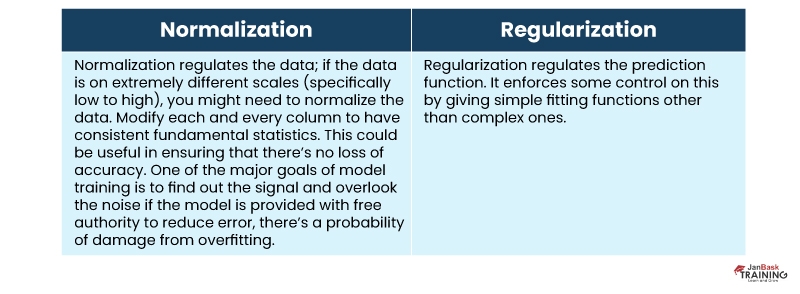
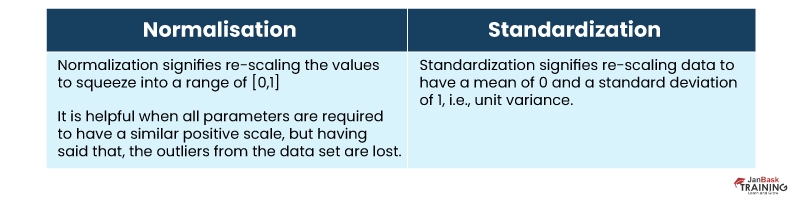
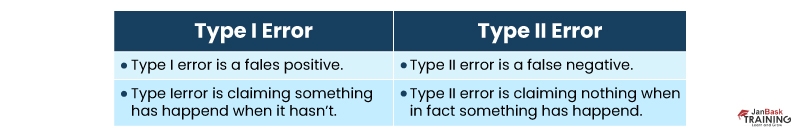
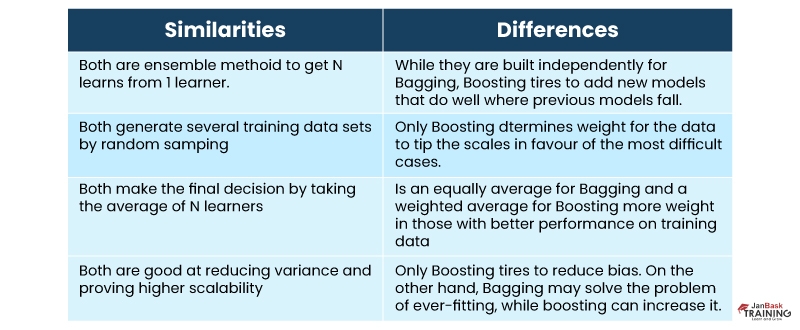
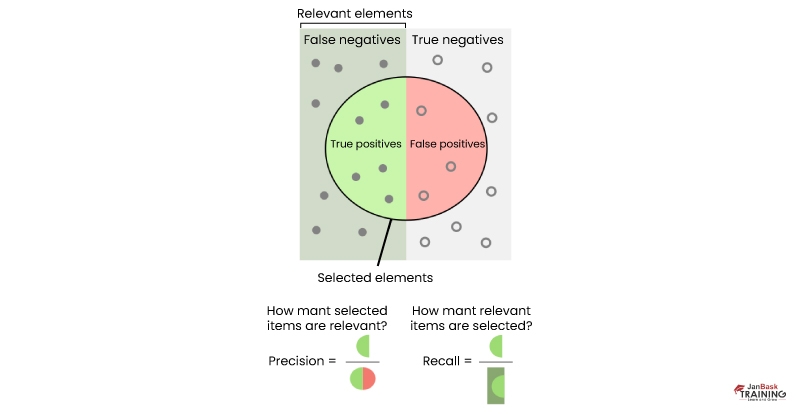
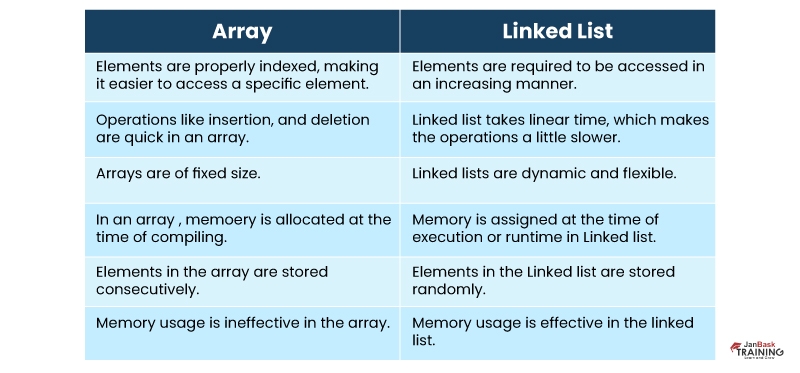

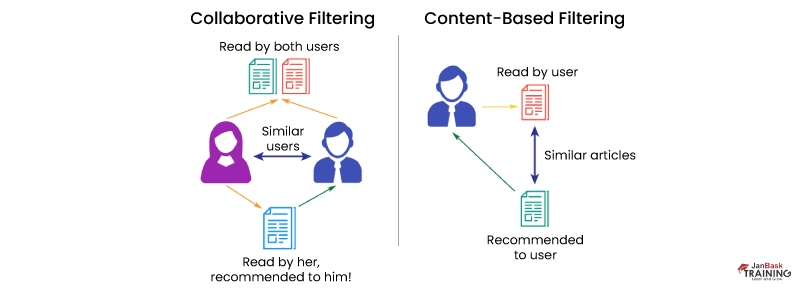


 Jan 18, 2025
 2.9k
2.9k

Kyle Lee
Next week, I have an interview and lucky, I got these Machine learning interview questions posted on time. Trust me after going through this post, feeling much confident for my upcoming interview.
JanbaskTraining
Hello, JanBask Training offers online training to nurture your skills and make you ready for an amazing career run. Please write to us in detail at help@janbasktraining.com. Thanks!
Riley Walker
One of the best question answer based posts on Machine learning interview questions, must read for people wishing to crack interviews.
JanbaskTraining
Hi, Thank you for reaching out to us with your query. Drop us your email id here and we will get back to you shortly!
JanbaskTraining
Hi, Thank you for reaching out to us with your query. Drop us your email id here and we will get back to you shortly!
Jorge Hall
To be very frank, I am not satisfied with a few answers but the question choice is amazing, listing all high weightage questions.
JanbaskTraining
Hi, you can visit the official website of JanBask training to get registered or else you can mail us your information at help@janbasktraining.com. Thanks!
Beckham Allen
What educational background is required for a growing career in Machine Learning And which certification is best for the beginner level.
JanbaskTraining
Hi, Thank you for reaching out to us with your query. Drop us your email id here and we will get back to you shortly!
Cayden Young
I am preparing for a Machine learning certification exam.Can you suggest any good community for Machine learning where i can explore more and follow a better way to crack the certification exam. Are there more booklets just like the above one! Please share relevant links, if any!
JanbaskTraining
Hi, you can visit the official website of JanBask training to get registered or else you can mail us your information at help@janbasktraining.com. Thanks!
Jaden Hernandez
Next week i have an interview related to machine learning, luckly i got this interview question guide and after going threw all the question i felt much confident. All thanks to this post.
JanbaskTraining
Hi, Thank you for reaching out to us with your query. Drop us your email id here and we will get back to you shortly!
Emerson King
How can I enter a machine learning career, what education is required and what is approx training and certification fee.
JanbaskTraining
Thank you so much for your comment, we appreciate your time. Keep coming back for more such informative insights. Cheers :)
Ronan Wright
I have gone through all the questions and one thing i want to point out is , few answers are explained very well. Thanks
JanbaskTraining
Hello, JanBask Training offers online training to nurture your skills and make you ready for an amazing career run. Please write to us in detail at help@janbasktraining.com. Thanks!
Karson Lopez
Earlier I was unable to distinguish between Collaborative Filtering and Content-Based Filtering but the easy way explained in this post is just amazing.
JanbaskTraining
Hi, Thank you for reaching out to us with your query. Drop us your email id here and we will get back to you shortly!
Arlo Hill
There are few concepts that I am struggling to understand(related to ML), is there any relevant community or consultant of janbask to discuss. How could I reach the janbask team?
JanbaskTraining
Hi, you can visit the official website of JanBask training to get registered or else you can mail us your information at help@janbasktraining.com. Thanks!