Feb 02, 2024
  2.6k
2.6k

01
AugMonth End Offerl : Get 30% OFF + $999 Study Material FREE - SCHEDULE CALL
Did you know Python was ranked the most popular programming language per the PYPL Popularity of Programming Language Index? The programming language accounts for 28.2% of the market share, which makes it top the chart. The Pandas library is at the heart of the versatility of this open-source language. Then comes what is DataFrame in Python, the cornerstone for storing and manipulating data in an accessible manner.
So, what is DataFrame in Python, and what relevance does it hold in the programming language? Also, learn about the best Python Certification course. Read further to know!
A DataFrame in Python is a way of storing and manipulating tabular data in the high-level programming language. DataFrames look like tables with columns and rows that you may find in any Google Sheet or Excel workbook. Check out this Python guide for beginners to learn about the programming language, what is DataFrame in Python and how to create a DataFrame in Python.
Hence, a DataFrame is a two-dimensional structure that the pandas library offers to its users. Consider it a container that helps store and manipulate labeled data in rows and columns.
Meanwhile, here are the features of a DataFrame function in Python:
The DataFrame data is always organized in a tabular format. It usually resembles an SQL table or a spreadsheet with rows and columns. Pandas in Python always provide a unique method to retrieve rows and columns from a DataFrame. Developers working on the programming language can easily retrieve them through proper analysis and calculations.
Indexing means selecting particular rows and columns of data from a DataFrame. The process could also mean selecting all the rows and some of the columns. It can be vice versa, too, which involves some of the rows and all of the columns, or some of each of the rows and columns.
All the rows and columns of a DataFrame in Python are related to an index or subset selection. The latter allows for easy access to manipulation of different types of data.
All columns within a DataFrame are labeled. Every column contains different data types. It may be strings, floats, or even integers. Sometimes, more complex data types like lists and other DataFrames are also stored in these columns.
Programmers simply need to put the name of the specific columns in between the brackets of the DataFrame to select a single column.
DataFrames allow users to handle missing data and reshape the same if needed. They also help perform various operations like filtering, grouping, and merging. The user also finds it easier to search for information on a DataFrame because it is in tabular form with different rows and tables.
You can learn more about what is Data Frame in Python by attending various courses. This involves attending various Python certificate programs to learn about the detailed process.
Knowing how to define a DataFrame in Python is not enough for professionals to excel in this field. Data professionals, analysts, and Python developers alike must know how to create DataFrame in Python.
The Pandas DataFrame is an important part of Python and is mostly used in data analysis and manipulation. You can learn more about Pandas by attending a Python online class.
Meanwhile, scroll below to learn how to create a DataFrame in Python Pandas.
Install the Pandas library into the specific Python environment. Then, create an empty basic DataFrame. Let us understand how to create a DataFrame in Python with the following DataFrame in Python example to know the process to create DataFrame in Python:
#import pandas as pd
import pandas as pd

#Calling DataFrame constructor
df = pd.DataFrame()

print(df)

Output:
Empty DataFrame
Columns: ()
Index: ()
Create a DataFrame using a list or list of lists. Here is another example of how to create a DataFrame in Python:
#importing pandas library
import pandas as pd

#string values in the list
lst = ['Java', 'Python', 'C', 'C++',
         'JavaScript', 'Swift', 'Go']

# Calling DataFrame constructor on list
dframe = pd.DataFrame(lst)
print(dframe)

Output:
0        Java
1      Python
2           C
3         C++
4   JavaScript
5       Swift
6          Go
Use the dict of ndarray/lists to create the DataFrame. Remember that the specific ndarray must be of the same length. Moreover, the index will be considered range(n) by default. Here, n denotes the array length.
To create dataframe in python, take a look at an ndarray-created DataFrame in Python example:
#import pandas as pd

#assign data of lists.
data = {'Name': ['XYZ', 'ABC', 'EFG', 'KLM'], 'Age': [19, 21, 18, 22]}

#Create DataFrame
df = pd.DataFrame(data)

#Print output
print(df)

Output:
     Name  Age
0     XYZ   19
1     ABC  21
2    EFG   18
3    KLM   22
Create an Index DataFrame using the arrays. Here is an example:
#import pandas as pd

# assign data of lists.

data = {'Name':['Maruti', 'Honda', 'Ratings':[8.0, 9.0]}

# Creates pandas DataFrame.

df = pd.DataFrame(data, index =['position1', 'position2')

# print the data

print(df)

Output:

 Name      Ratings

position1     Maruti      8.0

position2     Honda      9.0
Create a DataFrame using a list of dicts. It means you can pass the lists of dictionaries as input data to create the particular Pandas DataFrame. You must take the column names as keys by default. Take a look at the following DataFrame example:
#import pandas as pd

# assign values to lists.

data = [{'A': 10, 'B': 20, 'C':30}, {'x':100, 'y': 200, 'z': 300}]

# Creates DataFrame.

df = pd.DataFrame(data)

# Print the data

print(df)

Output:

   A      B      C      x      y      z

0  10.0  20.0  30.0    NaN    NaN    NaN

1   NaN   NaN   NaN  100.0  200.0  300.0
Create a DataFrame with the zip() function that helps merge two lists. Here is an example:
#import pandas as pd

# List1

Name = ['tom', 'krish', 'arun', 'juli']

# List2

Marks = [95, 63, 54, 47]

#  two lists.

# and merge them by using zip().

list_tuples = list(zip(Name, Marks))

# Assign data to tuples.

print(list_tuples)

# Converting lists of tuples into

# pandas Dataframe.

dframe = pd.DataFrame(list_tuples, columns=['Name', 'Marks'])

# Print data.

print(dframe)

Output:

[('tom', 95), ('krish', 63), ('arun', 54), ('juli', 47)]

    Name  Marks

0   tom       95

1  krish      63

2   arun     54

3   juli       47
The dictionary can also be passed to create a fresh DataFrame. You can use the dict of Series where the Index involves the union of all the Series of the earlier passed Index value. Let us understand what is DataFrame in Python with the help of the following DataFrame creation example:
#import pandas as pd

# Initialize data to Dicts of series.

d = {'Electronics': pd.Series([97, 56, 87, 45], index =['John', 'Abhinay', 'Peter', 'Andrew']),

   'Civil': pd.Series([97, 88, 44, 96], index =['John', 'Abhinay', 'Peter', 'Andrew'])}

# creates Dataframe.

dframe = pd.DataFrame(d)

# print the data.

print(dframe)

Output:

 Electronics      Civil

John            97        97

Abhinay      56        88

Peter          87        44

Andrew      45        96
Here are some Python project ideas that you should know about as a professional.
Now that you know what is DataFrame in Python and how to create a DataFrame in Python, let’s talk about the fundamentals of DataFrame Operations. There are different useful data operations for DataFrame in Pandas, which are as follows:
You can select any row and column of the DataFrame by passing the name of the respective rows and columns. The process becomes one-dimensional and is considered a Series when you select it from the DataFrame.
You can filter the data by providing some of the boolean expressions in DataFrame. One important thing to keep in mind here is that if you want to pass the boolean results into a DataFrame, it ends up showing all the results.
A Null value can occur when you do not get any data for the items provided to you. The columns may contain no values often represented as NaN. Several useful functions are available for detecting, removing, and replacing the null values in Dataframe in Pandas. These functions are:
This helps operate on string data and ignore the missing or NaN values in Pandas. Several string operations can be performed with the .str. option. These common functions include:
This particular operation is used to count the total number of occurrences using the 'value_counts()' option.
Pandas plots the graph with the help of the matplotlib library. The .plot() method allows them to plot the graph of the specific data type. The .plot() function also plots indexes against every column.
You can further pass the arguments into the plot() function to draw a specific column.
Pandas is an excellent tool that helps clean and preprocess various types of data. It offers various functions for transforming data, handling missing values, and reshaping data structures.
Pandas further helps you explore and understand your data. You can calculate summary and basic statistics, visualize data, and filter multiple rows or tables using Pandas' integration with Matplotlib.
Meanwhile, the process of data cleaning happens in the following ways:
Pandas provides a suite of methods to get purely integer-based indexing. The semantics closely follow Python and Numpy slicing. These are basically a part of the 0-based indexing. The start bound is included and the upper bound is excluded during the slicing process. Using a non-integer or even a valid label will raise an IndexError.
The .iloc attribute is the primary access method in Pandas for indexing and selection. Here are the valid inputs related to the Python library:
Quantitative work involves working with time series data at any time. A time series refers to an ordered sequence of data that represents how some quantity changes over time. Examples of such quantities could be high frequency measurements from a seismometer or yearly temperature averages measured at different locations across a century. The best part is that you can use the same software tools to work with them.
It is very popular to use the Pandas package to work with time series in Python. It offers a powerful suite of optimized tools to produce useful analyses in a few lines of code. A pandas.DataFrame object may include several quantities that can be extracted as an individual pandas.Series object. Moreover, these objects have several useful methods for working with time series data specifically.
Data visualization refers to the graphical representation of different data types and information. It is a powerful tool that helps understand complex data and communicate insights to others. Data visualization can be used for identifying trends, patterns, and outliers. You can also use the technique to explore relationships between variables.
Python Pandas provides powerful data structures and data analysis tools. This further includes data visualization capabilities. Pandas visualization is always created on top of the matplotlib library. This is a vital element that provides several customizable plots.
You must install and set up Pandas and load data into the respective DataFrame to import necessary libraries for data visualization.
Now that you know how to create a DataFrame in Python, rest assured that you have a powerful tool for efficient data analysis, manipulation, and visualization. It enables you to tackle diverse tasks in data science and analytics with confidence and ease.
Choose Janbask to undertake a Python certification online and learn how to create a DataFrame using the easiest methods. The Python online training will enable you to master advanced DataFrame operations and explore data visualization techniques. So, why wait? Enroll with us now!
Q1. What Is a Data Frame in Python?
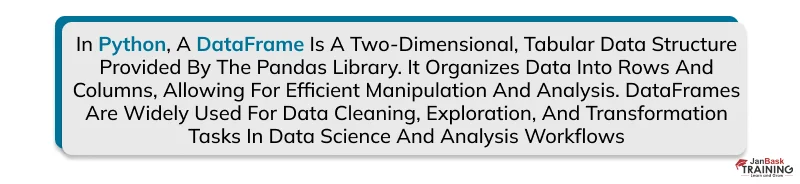
Ans. So, What is a Data Frame in Python? A DataFrame in Python is a two-dimensional, tabular data structure provided by the Pandas library. It organizes data into rows and columns, similar to a table, making it convenient for data manipulation and analysis.
Q2. Why Is Dataframe Used in Python?
Ans. DataFrames work like SQL tables or the spreadsheets associated with Excel or Calc. These two-dimensional labeled data structures are faster and easier to use. This makes them more powerful than tables or spreadsheets. That is why DataFrames become an integral part of the Python ecosystems.
Q3. Is Dataframe a Table in Python?
Ans. While DataFrame may have a similar tabular look, it is more than that when it comes to implementing the structure in Python. It involves several data structures and operations across systems that help run the programming language efficiently.
Q4. What Are the Most Common Data Structures?
Ans. DataFrames are one of the most common data structures in present times. They are used in all types of modern data analytics. These structures are a flexible and intuitive way of storing and working with different data types.
Q5. What Differentiates a Dataframe From a Dataset?
Ans. DataFrames always have a wider variety of Application Programming Interfaces (APIs). Moreover, these structures are more flexible when it comes to data manipulation. Datasets, on the other hand, have a more limited set of APIs. Yet, they are more concise and expressive than DataFrames.
Q6. Are All Dataframes Immutable?
Ans. A few DataFrames, like RDDs, are immutable. A new frame is always created when you define a transformation on another data frame. However, the original data frame cannot be modified in place in all cases.
Q7. Is Pandas Dataframe in the Form of a Table?
Ans. The Pandas DataFrame is like a Google or Excel spreadsheet. It represents data as a table with different rows and columns.
Q8. How Do I Create Dataframe in Python Using the Pandas Library?
Ans. To create DataFrame in Python with Pandas, you can use dictionaries or read data from external sources like CSV files. Explore the Pandas documentation for detailed methods on how to create DataFrame in Python.
Q9. What Is the Step-By-Step Process to Create Dataframe in Python?
Ans. First, install Pandas. Import it into your script or Jupyter notebook. Use pd.DataFrame() with a dictionary or other data structures to initialize your DataFrame. For example, pd.DataFrame({'Column1': [1, 2, 3], 'Column2': ['A', 'B', 'C']}). Experiment with data sources and Pandas functions for creating DataFrames in Python.
The JanBask Training Team includes certified professionals and expert writers dedicated to helping learners navigate their career journeys in QA, Cybersecurity, Salesforce, and more. Each article is carefully researched and reviewed to ensure quality and relevance.


Gen AI

Agentic AI

AI in Automation Testing

Cyber Security

Data Science

QA

Salesforce Service Cloud

AWS
Interviews


 Jan 06, 2023
 5.2k
5.2k