
 May 19, 2022
  680.5k

26
SepGrab Deal : Upto 30% off on live classes + 2 free self-paced courses - SCHEDULE CALL
- Tableau Blogs -
To derive truth and meaningful information from data, analytics is taken as the primary enabler and helps in business growth too. Today, almost every company relies on data heavily as we compile digital information everywhere. Here BI actually makes sense in the modern data landscape. There are plenty of Business Intelligence tools in the market offer benefits like analytics, reporting, and documenting for streamlining presentations. To enable all these features, some of the important tools are Tableau, QlikView, Power BI and Spotfire etc.
If you are planning to explore all these tools and want to know the differences among them which suits your business domain the most then this blog post is dedicated to you. Here, we have given a brief introduction to each of the tools, pros, and cons of all three tools and which one is better as per your business needs and functional requirements. Also, don’t forget to get a free demo session of all the tools to understand how they work.
This blog is curated to give an insight of comparisons amongst all of these tools. I.e. Tableau vs Power BI and Qlikview vs Power BI. In short, Power BI vs Tableau vs Qlikview. Let’s go ahead and understand each one of them-
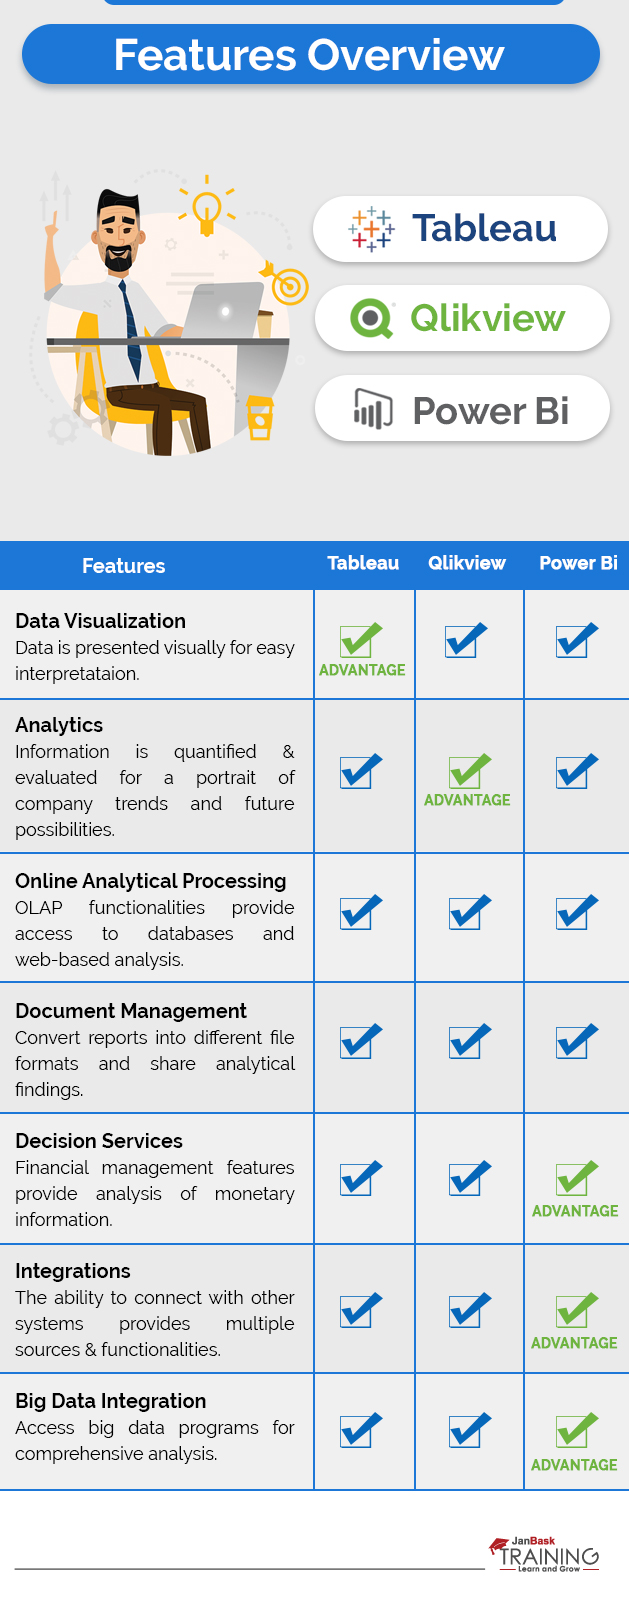
Here we are giving a quick comparison of features for all three tools – Tableau, Microsoft Power BI, and QlikView. The features that we have compared in this blog include Data Visualization, Analytics, document Management, OLAP, Integration, Decision Services, Big data services etc.
In terms of visualizations, Tableau leads the IT marketplace and supports robust analytics functions, clustering, segmentation, advance data federation etc. This tool has a user-friendly interface that can be customized quickly to provide detailed business information. Further, the drag-drop features of the tool allow users to connect and extensive data sources quickly and making Tableau a front-runner in the industry in data visualizations.
Next tool on the list is QlikView that involves multiple report generation features, customizations, visualization techniques, robust graphics etc. Here, important data can be displayed on the quick reference. The strength of this tool majorly includes visualization patterns and associated analytics that cannot be achieved by the SQL alone. The tool is scalable enough to integrate with multiple data sources and there is one dashboard to showcase key performance indicators.
Microsoft Power BI is another user-friendly data visualization tool leading in the BI space. This tool also has drag-drop features with quick access to more than 80 data visualization apps. This is always easy preparing highly interactive reports with the tool that can be shared across the team and accessed on multiple devices.
Verdict: For data visualization, Tableau leads the IT market with a complete range of features like intuitive UI, real-time analytics, customizations etc.
To reflect the urgent analytics requirements of an organization, Tableau is just the right choice. This is the next step to data visualizations and improvements to mobile authoring and exploration. If some organization wanted to move beyond data visualization then you can opt for analytics tools ahead. It gives amazing support for complex data workflows, making dirty data more usable and suitable for making business decisions ahead.
Read: Tableau Developer Salary for Beginners & Professionals: 2025 Updated Figures
You can combine unlimited data sources together in case of QlikView without making any initial preparation. The tool is using an in-memory engine for data analysis and enabling data discovery and patterns that cannot be don’t by SQL alone. Next advantage of the tool is the social media analytics function of the tool that collects data from multiple social networks like Twitter, Facebook, Google + and more. It also promotes automatic analysis and data insights when the user interacts with data sources. The analyzed data is useful for organizations in multiple ways at different levels.
The Microsoft Power BI tool is easy to learn that offers affordable BI experiences. It looks very much similar to Excel with recognizable functionalities. Further, the tool involves multiple complex data analysis functions, integration points. Other than this, data discovery, data preparation, and interactive dashboard capabilities are also included in the Power Suite. The data management has gone much simpler with multiple tools and techniques. Besides, the standard data analysis, the tools offers location-based analysis services too.
Verdict: When comparing all three tools, QlikView certainly wins an edge here because of the best analytics features. This is a more flexible analytics platform allowing businesses to customize guided applications that are updated during use.
Tableau Online Training & Certification

Tableau could support publishing analytics content for a variety of platforms. The options that are supported by the tool include PFDs, images, excel, spreadsheets, or crosstabs etc. Most importantly, the user has the flexibility to view multiple stages of a report creation and it achieves all past versions to view later.
There is one PDF report distribution plug-in in QlikView that could convert reports into multiple supportable formats like HTML, XML, XLS, or PDF formats etc. This tool also supports the script files for flexible tracking. The tools can also judge data fluctuations too whenever needed. Further, reports generated in Microsoft Power BI can be quickly exported to multiple formats like HTML, Microsoft files, PDFs, or TIFF files etc. AS we know Power BI has a strong back that is Microsoft that makes documents management much easier but it does not support any version control directly.
Verdict: According to our research, all three tools are considered equally important in terms of document management. All of them are able to create and convert reports in multiple formats as needed.
To explore the multiple layers of data at the deeper level, Tableau connects data sources to OLAP cubes. It has drill-down features, filtration capabilities, automatic analysis features etc that helps in working on multidimensional datasets suitably and access insights provided by datasets.
Read: Tableau Desktop Certified Professional Exam Guide: Cost, Format & Study Tips
At the same time, QlikView offers encapsulated data views for multiple datasets where data analysis is possible to perform at the deepest levels and releasing insights as needed. The tool can extract data from larger datasets and explor it to the deepest levels.
Microsoft Power BI tool connects to OLAP cubes by SQL servers for multidimensional data analysis, pattern identification, information gathering, data mining, predictive analytics features and more. It gives you a detail of data measures to display in the report. Also, you can select the multiple dimensions too that are features alongside when creating reports.
Verdict: From this discussion, it is clear that all three tools Tableau, QlikView and Microsoft Power BI offer the same OLAP capabilities at the expected levels.
Tableau offers improved support for the REST APIs, JavaScript etc and making integrations possible across multiple analytics platforms. It offers streamlined collaboration for other programs as well like SAP, Google Analytics platform, MS Office, or ERP software program, or software programming channels etc. The tool has security integration features too.
Next is the QlikView tool that offers an advanced API command set for the analytics industry and continually improving its performance from the last many years. It offers streamlined integration with other tools and libraries too. When organizations always ask for API support, QlikView seems just a wonderful choice here.
Microsoft Power BI possesses multiple advantages and connections with assorted applications too. This tool can mine the data from multiple programs when multiple data sources are added almost every month.
Verdict: Here, Microsoft Power BI wins the race with seamless integration features with a number of external applications and offers a wider range of collaboration options too.
Tableau helps in data interpretation and improves the overall decision-making capabilities too. It detects the frauds in the software that are taken as the robust security measure. Besides, it is also used for data interpretation, controlling data governance, effective metadata management and more.
QlikView is another popular tool that provides accurate knowledge and analysis details that further leads to the informed decision-making process. The security features are reducing fraud detection ahead. A wide range of BI tools available in QlikView can always be learned quickly and add to their learning system instantly.
Read: How to Create & Format Tableau Worksheet?
Next is Microsoft Power BI tool that is named as the financial analysis tool and popular for fraud detection, compliance security and adding extra security features to the system as well. The tools give wonderful support for all inquiries related to the software functions. The other features of the tool include fraud detection, financial analytics, security measures, compliance monitoring and more.
Verdict:
After the Power BI vs Tableau vs Qlikview comparison the verdict is that, Microsoft Power BI is placed little higher as compared to the other two, it provides an extensive source of know-how unmatched by competitors.
Tableau Online Training & Certification

The discussion makes it clear that Tableau, QlikView, and Power BI are wonderful data management tools and which one suits you the most completely depends on your business requirements. When working with an existing database, data warehouses and connection with other data sources is vital. So, you must individually analyze the solutions against the requirements and configurations.
When Visualizations are the core focus area then Tableau is just the right fit. For deep analytics and high adaptability, QlikView is ranked higher. At the same time, Microsoft Power BI is affordable and offers seamless integrations with MS office. This is a wonderful choice of powerful reporting, integrations, and big data services. Further, it ensures the maximum scalability for larger projects.
Overall, Microsoft Power BI is a comprehensive choice among other tools and its integration capabilities cannot be matched by any of its competitors. This is a user-friendly tool with BI features and big data management capabilities. So, tell us your comments which tools have you chosen for your project and why?
Which tool did you like the best? Sign up for the individual tutorials of Power BI, Qlikview and Tableau here!
Read: What is set in Tableau and When to use Set-in Tableau?
 FaceBook
 Twitter
 LinkedIn
 Pinterest
 Email
Email
The JanBask Training Team includes certified professionals and expert writers dedicated to helping learners navigate their career journeys in QA, Cybersecurity, Salesforce, and more. Each article is carefully researched and reviewed to ensure quality and relevance.


Cyber Security

QA

Salesforce

Business Analyst

MS SQL Server

Data Science

DevOps

Hadoop

Python

Artificial Intelligence

Machine Learning

Tableau
Search Posts
Related Posts
Receive Latest Materials and Offers on Tableau Course
Interviews


 Jan 05, 2022
 4.7k
4.7k

 4.7k
4.7k