
 Feb 12, 2020
  4.7k
4.7k

26
SepGrab Deal : Upto 30% off on live classes + 2 free self-paced courses - SCHEDULE CALL
In this post, we are going to talk about what a pie chart is when to create a pie chart and how to create a pie chart in tableau. We will be using the sample superstore data set for the demonstration. We will also see how you can format the pie chart and show the relevant information.
A pie chart is one of the most useful graphs in visualization where we divide a circle into a different number of segments which will represent a proportion of the entire.
A pie chart is also considered as an alternative to a bar chart where in place of the frequency we show the proportions. For example, if you have to show how much sales we have made in each category then the bar chart can be an ideal chart. But if you have to so what is the percentage contribution by its categories in the total sales then the pie chart can be the ideal chart.
There are different combinations of pie charts like a doughnut chart which also help to represent some advanced form of data. In this article, we are going to talk about all the things about the pie chart.
A pie chart can be created when you have to show the proportions as a whole. For example, if you have to find the contribution made by each source in your monthly income. In such a case, pie chart can be one of the ideal charts to demonstrate these details. While creating the pie chart make sure to format it well.

A pie chart can be created for the below scenarios -
And there can be few other similar requirements for the creation of a pie chart. If you have any such requirement by chart can be preferred over any other chart.
If you will look for the official requirement for the pie chart in tableau it says it should have one or more dimensions and one for max two measures. If your requirement satisfies these conditions you are good to create a pie chart.

Example:
Read: Know Average Tableau Developer Salary for Freshers & Experienced Professionals!
Let's say we need to find a percentage of sales by each category. That means we need to find out of total what is the proportion by category Technology, furniture, and Home appliances. As we have to find the proportion of these categories, so a pie chart can be a better option.
Now let’s create a pie chart just by following the below steps-
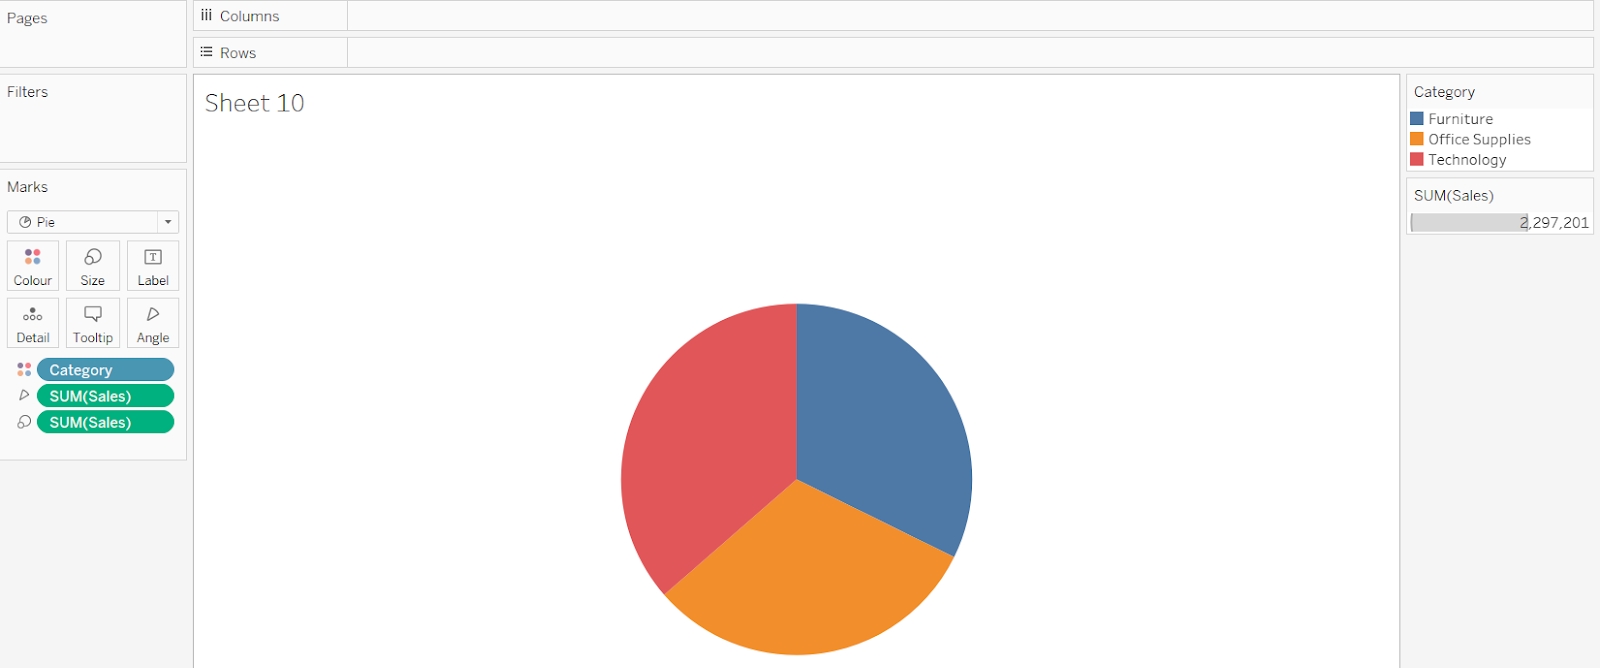
This will create a pie chart like below-

Now, this is a generic pie chart that is not telling a lot of information to you. Although when you hover on the pie chart on the tooltip you will find the relevant information. But to make the chart user ready we need to format this pie chart. In the next section, we are going to format the pie chart.
As you can see, the size of the pie chart is very small. There are a couple of ways to increase the size of the pie chart-
Both the above techniques work perfectly and you will have to decide which option to go for. I prefer going the entire view as this option adapts as per the screen size. Once you will make the screen size entire view, you will get the screen like below -
As we know, angles are calculated while creating the pie chart and so you can find the sum of sales as the angle. Also, the categories are divided into the color self and so all those legends are showing you at the right top corner. You can change the place of those legends as you want. There is a size option for the sum of sales as well. You can also reposition that as per your requirement.
As of now, the size of the pie chart looks good and we need to further format it for the legends and labels.
You should also consider formatting the colors of these categories. Usually, we follow the color palette as per the organization’s color structure or the requirement received.
In our example, we are not going to change the color of these categories but we will format the legends and the label.
Read: All You Need to Know About Tableau Certification
To enable the level, we can either click on the T-icon showing you at the top or click on the level field in the marks card and allow levels. I Prefer going through the second option.

Now the level is showing you on the pie chart but the numbers are the total amount of sales made by these categories. As we know pie charts are majorly being used to show the proportions but here, we are showing the numbers.
So, we need to convert these numbers into the percentage proportions as a whole. To convert these numbers to the percentage, go to analysis in the menu and select the percentage of the table. This will convert each number into the percentage of the total which is our desired result.

You can see now we are having the percentage contribution by each category on the total amount of sales. If you also want to show the name of the category is in the label, drag the category dimension into the labels shelf.
Once you do that, the category name will be shown to you as a level. But no longer the percentage by each category. To enable the percentage contribution also drug sum of sales into the level self again.

As you can see, we have now both the category name and the percentage contribution in the sales by those categories. If you want to change the color of these proportions you can go to the color shelf and select the desired color or color palette.
Currently, the percentage is showing you up to 3 digits after the decimal. If you want to format this you can right-click on it and select format and further customize this as per your requirement.
Tableau Online Training & Certification
Read: Tableau Developer Resume Sample + Complete Guide on How to Make One

Example-2:
Let's say, you have to create a pie chart for the total number of orders in each state. You can follow the previous steps to create a pie chart for the proportions of orders in each state. The changes will be in place of the category we will have to use the state and in place of sales, we need to use a number of records. Once all the formatting did you will get the pie chart like below -

Look at this pie chart and analyse whether this pie chart should have been created or not. As you can see there are a lot of sections in this pie chart which are making the readability very poor. And so, the pie chart might not be the ideal chart for this particular requirement. You can play around the other charts for this requirement. One of the possible charts for this requirement can be a bar chart, other can be a Treemaps.
So, it's very important you decide whether you should use the pie chart for the given requirement or not. It should not be always that if you have to find the proportions you must use the chart.
You can also use the dual axis on the same pie chart and create a chart called a doughnut chart which we will talk about in some other article. A doughnut chart is an advanced form of Pie Chart itself with some additional information.
Best practices to create a pie chart
Tableau Online Training & Certification

This is all about the pie chart. In this article, we talked about what is a pie chart on how to create it when to use it, the alternatives around it, and formatting a pie chart. We also talked about the best practices to create a pie chart. Do try it now and let us know for any difficulty.
Read: Tableau Server Certification Associate Preparation Guide
 FaceBook
 Twitter
 LinkedIn
 Pinterest
 Email
Email
The JanBask Training Team includes certified professionals and expert writers dedicated to helping learners navigate their career journeys in QA, Cybersecurity, Salesforce, and more. Each article is carefully researched and reviewed to ensure quality and relevance.


Cyber Security

QA

Salesforce

Business Analyst

MS SQL Server

Data Science

DevOps

Hadoop

Python

Artificial Intelligence

Machine Learning

Tableau
Search Posts
Related Posts
Receive Latest Materials and Offers on Tableau Course
Interviews


 Aug 24, 2020
 3.8k
3.8k

 3.8k
3.8k