
 Mar 20, 2020
  3.8k
3.8k

26
SepGrab Deal : Upto 30% off on live classes + 2 free self-paced courses - SCHEDULE CALL
- Data Science Blogs -
Multivariate analysis (MVA) refers to the suite of statistical techniques used to analyze data consisting of more than one variable.
In many disciplines, notably community ecology, we have several samples and we wish to explore the relationship between samples in terms of species composition or communities. The presence of multispecies makes our data multivariate.
Ordination is an important aspect of MVA.
Different ordination methods take samples/sires and reorder them according to the species composition.
It is also possible to use predictor variables (say environmental conditions) to align or categorize the data.
There are two types of Multivariate analysis:
Indirect Gradient Analysis: Starting with just the species composition in various samples. The impact of predictors inferred later on. This includes methods like Principal Component Analysis (PCA), CA, NMDS. We look for patterns in data (and their possible causes) by examining patterns of species composition or any other response variable across different sites.
Direct Gradient Analysis: Both the response (e.g. species) and predictors are used to identify the patterns in data. E.g. cluster analysis-cluster species (response) based on predictors.
All these methods use some form of dissimilarity matrix/distance measures to separate the different species groups.
Principal Component Analysis (PCA) is an ordination and dimensionality reduction technique that is widely used in ecological data analysis. We convert our numerical predictors into a set of uncorrelated variables developed as a linear combination of predictors (known as principal components) which explain the maximum variation in the data. Conversion of higher dimensional data to lower dimension data (latter is a normalized linear combination of predictors).
The first principal component is a linear combination of original predictor variables which captures the maximum variance of the dataset. This minimizes the sum of squared distance between a data point and the line. Second principal component captures the remaining variance and is uncorrelated to the first PC and these 2 are orthogonal.
Read: SQL- A Leading Language for Data Science Experts
In multivariate analysis, the dimension of X causes problems in obtaining suitable statistical analysis to analyze a set of observations (data) on X. It is natural to look for a method for rearranging the data so that with as little loss of information as possible, the dimension of the problem is considerably reduced. This reduction is possible by transforming the original variables into a new set of uncorrelated variables. These variables are known as Principal components.
Principal components are a normalized linear combination of original variables which has specified properties in terms of variance. They are uncorrelated and are ordered. So that the first component displays the largest amount of variation. The second component displays the second-largest amount of variation and so on.
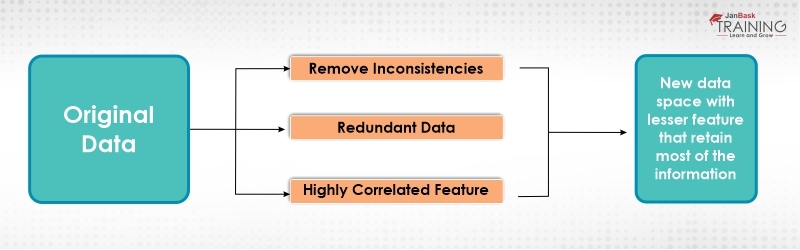
Figure 1: Principal Component Analysis
If there are p variables then p components are required to reproduce (rearrange) the total variability present in the data. This variability can be accounted for by a small number k < p of the components. If this, so there is almost as much information in the k components as there is in original p variables and then k components can replace the original p variables. That is why this is considered as a linear reduction technique. This technique produces the best results if the original variables are highly correlated positively or negatively.
Example
Suppose we are interested in finding the level of performance in Mathematics of the 10th -grade students of a certain school. We may then record their scores in mathematics i.e. we consider just one characteristic of each student. Now suppose we are interested in overall performance and select some p characteristics such as Mathematics, English, Science, etc.
These characteristics although related to each other but it is possible that all of them may not contain the same amount of information. And in-fact some information can be completely redundant. This will result in loss of information and waste of resources in analyzing the data. Thus, we should select only those characteristics that will truly discriminate one student from another while those least discriminately should be discarded.
The Need for Principal Component Analysis
High dimension data is extremely complex to process due to inconsistencies in the feature which increase the computation time and make data processing more convoluted.
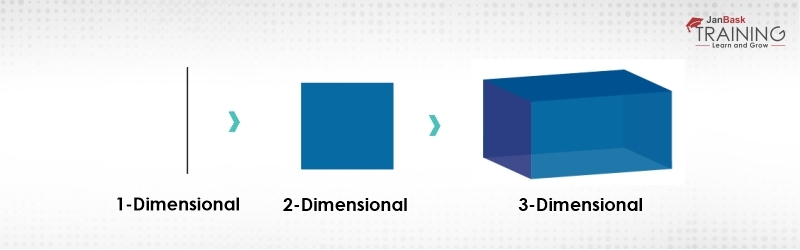 Figure 2:Curse of Dimensionality
Read: Latest Data Science Course Syllabus: Mastering Data Science
As we can observe the complexity is increasing as the dimensionality increases and in real life, the high dimension data that we are talking about has thousands of dimensions that make it very-very complex to handle and process. This high dimension data can be easily found in use cases like image processing, natural language processing, image translation and so on. So, this is what exactly the curse of dimensionality means.
To get rid of this Curse of dimensionality, we came up with a process which is known as dimensionality reduction. Dimensionality reduction technique can be used to filter only a limited number of significant features which are needed for training your predictive model or machine learning model.
While performing dimensionality reduction technique, it should be kept in mind that we perform the process in such a way that the significant data is retained in the new dataset.
PCA is a very simple and logical concept and it is implemented in the majority of machine learning algorithms as machine learning has a limitation that it cannot process or handle data of high dimension. So that’s when PXCA comes into the spotlight.
Step by Step Principal Component Analysis

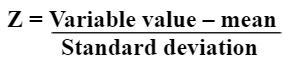
Step 1: Data Standardization
Data standardization includes scaling of information so that all the factors and their values exist in a similar range. It is denoted by Z.
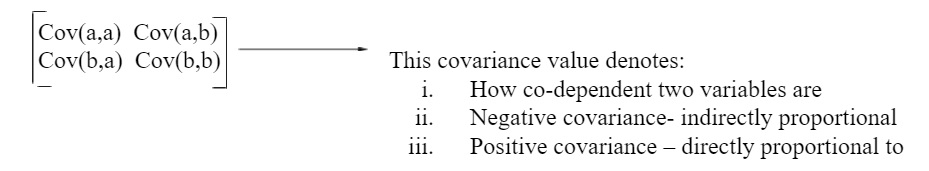
Step 2: Covariance Matrix Computation
A covariance matrix shows the correlation between the different factors in the dataset. It is necessary to find a heavily dependent variable they contain biased and redundant information which reduces the overall performance of the model.
 Step 3: Calculation of Eigenvector and eigenvalues
Read: Introduction to Regression Analysis & Its Approaches
Eigenvectors and eigenvalues are necessary for determining the principal component of the data set and this eigenvectors and eigenvalues must be calculated from the covariance matrix.
Step 4: Principal Component Computation
After computing the eigenvector and eigenvalues, the next step is to order them in the descending order, where the eigenvector with the highest eigenvalue is the most significant and thus forms the first principal component.
Step 5: Dimension Reduction
The last step in performing PCA is to rearrange the original data with the final principal component which represents the maximum and the most significant information of the dataset.
Conclusion
Nowadays, with the continuous advancement in technologies, fields like Machine learning and Artificial Intelligence is very important in every aspect of life. As of now, people are using machine learning in almost every field. But whenever machine learning is used it should be kept in mind that in this, we always use multidimensional data and analysis of multidimensional is very difficult as it increases inconsistency in data and also increases the processing. This problem is also known as the Curse of dimensionality. But this problem can be easily resolved by reducing the dimension of your data and we can perform this dimensionality reduction by using a concept known as Principal component analysis (PCA). By using PCA we convert our high dimensional data into lower dimensional data. Hence, it can be concluded that PCA is an effective approach to data analysis.
Please leave the query and comments in the comment section.
 FaceBook
 Twitter
 LinkedIn
 Pinterest
 Email
Email
The JanBask Training Team includes certified professionals and expert writers dedicated to helping learners navigate their career journeys in QA, Cybersecurity, Salesforce, and more. Each article is carefully researched and reviewed to ensure quality and relevance.


Cyber Security

QA

Salesforce

Business Analyst

MS SQL Server

Data Science

DevOps

Hadoop

Python

Artificial Intelligence

Machine Learning

Tableau
Search Posts
Related Posts
An Ultimate Guide To Python For Data Science (2025)
 6k
6k
How to import Data into R using Excel, CSV, Text and XML
10.2k
Data Science Career Path - Know Why & How to Make a Career in Data Science!
219k
Data Scientist Resumes That Will Get You An Interview Call
215.6k
Learn Data Science Seamlessly: Tips to Elevate Your Learning Curve
4.6k
Receive Latest Materials and Offers on Data Science Course
Interviews


 Apr 03, 2025
 6k
6k
