
 Nov 13, 2019
  4.4k
4.4k

20
SepGrab Deal : Upto 30% off on live classes + 2 free self-paced courses - SCHEDULE CALL
- Python Blogs -
In the era of artificial intelligence and analytics, data has taken the driving seat of almost all the industries. From Zomato to Google all are using data to improve their business models at the same time cater in a customer-specific way to their clientele.
In this blog, we will be first of all talking about the data followed by checking a dataset which will comprise of numerous steps starting with start with checking of inconsistent values followed by checking & removing duplicates and ending on creating labels for a supervised learning-based model. Most prominently, in this blog, we will be talking about the manipulating data using python.
Data is the collection of facts and figures. However, in its raw form, data most of the time is not suitable for further processing. In other words, most of the time, there is a requirement for changing the data into another more suitable format. The process of changing and mapping the data into a more suitable form is called data wrangling, which is also known by the name of data munging.
Almost anybody who deals with data in their daily life will agree that data is dirty and cannot be directly used to infer anything meaningful. Thus, it becomes essential to clean it i.e. to perform data wrangling. It is an essential part of data science. This is an example we are present the basics of data wrangling using pandas in python using the forest fire in Brazil dataset which is available at kaggle.com.
Pandas is a software library for python which was originally released in 2008 by Wes McKinney. It is widely used for data analysis and manipulation. In this blog, data munging will be performed over a spreadsheet in csv format. Here, pandas data frames are 2-D data structure comprising heterogeneous data in rows and columns which is somewhat similar to a table. Thus, can be easily manipulated in python over rows and columns.
In this blog, forest fire in brazil dataset as available on kaggle, which open for use is used.
Read: Python Certifications Guide - Types, Exam Details, Preparation Tips
Any dataset can have absent values which are usually represented by a NAN at the place of value. Here it’s important to mention that NAN, which stands for not a number, represents a null value.
Let us query our dataset for null values. (The dataset is having an encoding of cp1252. The default encoding is utf-8.).
>>Import pandas as pd
>>X=pd.read('../qwe.csv',encoding='cp1252')
>>Pd.isnull(x).any()
As seen in the Figure 1, As seen in the above query, there is no missing value in this dataset. But, if there are missing values, they can be dropped or other statistical measures can be used to interpolate or extrapolate them.
Huge datasets may have duplicate values in them making them introduce bias in the final output. Thus, it is important to remove the duplicates. Before we can drop the duplicate values from this dataset, it is important to know that there are any duplicate values in the data set.
To do this, one should first find the count of columns and this can be done by using the describe() function as shown in fig.2 :
>> x.describe()
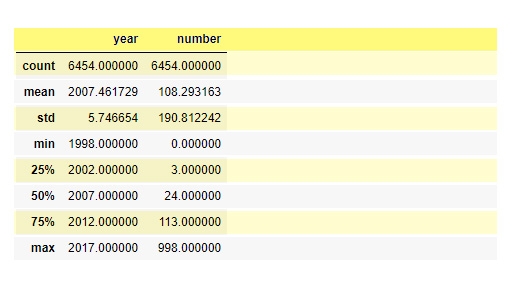
Figure 2: Describe
Read: How to Use SQL with Python?
This summarizes most of the statistical features of the dataset under consideration. Now, nunique() can be use to find out the number of unique values in the dataset per column.
>>x.nunique()
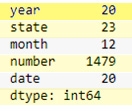
Figure 3:
As evident from figure 3, there are a total of 6454 values, but that does not correspond to the unique values in any reported figure. Thus, few data points might be repeated in the dataset. To segregate the data year wise we can do as follow:
X[x.duplicated(subset='year',keep=False)].sort_value('year')
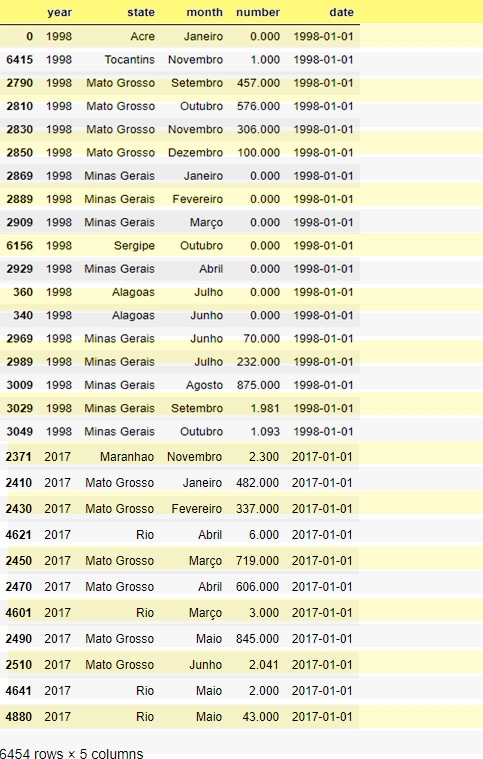
Figure 4:duplicate results
As can be seen in Fig. 4, all the dataset is unique because it is presented in a mapped form. Thus, there are no duplicate values in this dataset. But, for demonstration the instances where year is repeated will be removed from the dataset.
Read: Python String Methods - What should you know?
Repeat_x = x.groupby(by = ‘year’).size().sort_values(ascending = False)
Filtered_x = repeat_x[repeat_x >2].to_frame().reset_index()
Filtered_x = x[~x.year.isin(filtered_x.year)]
These commands will remove places where the year is repeated more than twice. This can be made more specific with the use of conjunctions. Negation ‘~’ needs to be used or all else instances where the occurrence is more than twice will be returned. The last step in the above process is known as data filtration and is used to remove or add data points as per requirements.

The basic purpose of the whole of data wrangling is to give the dataset a usable form, which can be used in further analysis or implement machine learning models. Thus, this step forms the most important part of data wrangling. Before this step, checking the parameters and shape of data is required. In this step, the dataset will be mapped for the binary supervised learning-based model i.e. every data point in the dataset will be mapped to 1, if forest-fire has taken place or else it will be mapped to 0
>>mapping = [] #creating an empty list

>> for I in range(len(x)):

>>      if(x.loc[i,”number”] !=0:

>>              mapping.append(1) #appending labels

>>       else:

>>               mapping.append(0)

>>x['label'] = mapping

>>export_csv = x.to_csv (r'd:\amazon_mapped.csv', index = None, header=True)
To map the data, an array named mapping is created. Now, the number column in original data contains the number of times fire has occurred in that area. To make a binary classifier, we will restrict ourselves to whether a fire has occurred or not. To do this, we will first make the corresponding entry in the mapping array and then, initialize this array to the data frame. Once, entry to a data frame is done. We can export this to the desired location as done in the last line of command.
In this blog, the basics of data wrangling in python using pandas have been discussed and the dataset has been labelled for training of binary classifier. This python example depicts the basic steps and can be enhanced for more complex use in the domain of data science. In other words, a basic data wrangling project can be done using this. Please leave query and comments in the comment section.
Read: 17+ Best Python IDEs: Top Picks for Students & Professionals
 FaceBook
 Twitter
 LinkedIn
 Pinterest
 Email
Email
The JanBask Training Team includes certified professionals and expert writers dedicated to helping learners navigate their career journeys in QA, Cybersecurity, Salesforce, and more. Each article is carefully researched and reviewed to ensure quality and relevance.


Cyber Security

QA

Salesforce

Business Analyst

MS SQL Server

Data Science

DevOps

Hadoop

Python

Artificial Intelligence

Machine Learning

Tableau
Search Posts
Related Posts
Receive Latest Materials and Offers on Python Course
Interviews


 Sep 04, 2025
 818.7k

 818.7k