Introduction
Advanced Excel functions of Microsoft have made it the most used application around the globe. Over an estimated 750 million to 1.2 billion monthly users globally is not something that can be ignored.
With over 8,79,851 companies in the United States using the Microsoft office suite software alone, Microsoft Excel is the go-to tool for working with data.
But what makes Excel a widely used software? It's the ability to generate reports and business information in modern industries seamlessly. Excel also supports several in-built applications that make it easier to use. One such feature that allows Excel to stand out is - Excel formulas.
In this blog, we will look into the top 30 Advanced Excel formulas & functions that one must know , how data science courses can be useful to you and how to upskill or build a career in data science or related IT fields. The topics we will cover in this article include:
- What are Excel Formulas & Functions?
- Top Excel Formulas and Functions
- Time-saving Ways to Insert Data into Excel
- Tips For Working With Microsoft Excel
Also, if you are a beginner, here are the top Online IT courses where Excel skills are much sought-after.
What are Excel Formulas & Functions?
In Microsoft Excel, a formula is a term that operates on values within a range of cells. These formulas return a result, even when it is an error. Microsoft Excel formulas help you to identify the relationships between the values in the cells of your spreadsheet, make mathematical calculations using those values, and return the resultant value to the cell of your choice.
There is another term that is quite familiar to Excel formulas, and which is "function". Sometimes the two words "formulas" and "functions" are swapped. They are closely connected but different. A formula starts with an equal sign. In the meantime, features are used to perform complex computations that cannot be performed manually. Functions in Excel have names that reflect their intended use.
The following example shows how we used the multiplication formula manually with the operator «*».

This example below shows how we used the - ‘PRODUCT' feature to multiply. As you can see, we didn’t use the mathematical operator here.
Excel formulas and functions carry out your tasks effectively and save you time, also with JanBask Training you can learn about the various courses and Excel in the field of your choice.
Now, let's proceed and learn the different types of functions available in Excel and use appropriate formulas from the Excel functions list as needed.
What is Advanced Excel?
In today's data-driven world, advanced Excel is a crucial skill for efficiently handling large amounts of information. It enables professionals to complete a wide range of business activities, including organizing data in spreadsheets, creating informative graphs and tables, performing complex calculations, and automating repetitive tasks.
The versatility of Excel allows it to be utilized in various ways, tailored to the specific demands and responsibilities of different departments or job categories. By mastering advanced Excel features, you can elevate the presentation of your data to top management, presenting insights and trends in a visually appealing and impactful manner.
Developing advanced Excel skills opens up opportunities for improved data analysis and decision-making across industries. Refer to what is data analytics to learn more about it.
Creating Formulas Step by Step
Excel formulas are also called syntax. It is primarily used to perform mathematical calculations. In MS Excel, the formulas start with an equal sign (=) in the cell, then the calculation.
The steps to executing a formula are as follows:
- Choose a Cell
- Type in the equal sign (=)
- Choose a cell or type value
- Type in an arithmetic operator
- Choose another cell or type value
- Press Enter
Mastering the basic Excel formulas is critical for beginners to become highly proficient in financial analysis. So, let's look at the top Excel formulas and functions that are extremely important for beginners and experienced corporate professionals.
Excel is widely used in the field of Data Analytics; if you are a beginner, then learn to master analytics tools and techniques with a comprehensive Online Data Analytics Course.
Top 30 Advanced Excel Formulas & Functions
Advanced Excel functions are powerful tools that extend the capabilities of Microsoft Excel beyond basic calculations and data management. These functions enable users to perform complex data analysis, automate tasks, and enhance productivity. With advanced functions, users can create dynamic reports, perform sophisticated calculations, and streamline their workflow, making Excel a versatile tool for data analysis and decision-making. Let's look into the most used excel functions.
1. SUM
The SUM() function, as its name indicates, adds up the selected range of cell values. It carries out the mathematical operation which is addition. Here’s an example:
As you can see above, to find the total amount of sales for every unit, we had to simply type in the function “=SUM(C2:C4)”. This automatically adds up to 400, 525, and 660. The result is stored in C5.
Excel plays a pivotal role in importing data. So, check out how to import data into R using Excel, CSV, Text, and XML and gain complete knowledge of this domain.
2. COUNT
In the Excel formulas list, The COUNT formula is denoted =COUNT(Start Cell: End Cell). It does not include the cell, which is blank, and those who hold data in any other format than numerical.
As seen above, we are counting from C1 to C4, ideally four cells. But as the COUNT function only considers cells with numeric values, the response is 3 because the cell containing "Total" is omitted.
If you have to count all cells with numeric values, text, and any other data format, you must use the ‘COUNTA()' function. However, COUNTA() does not count any blank cells.
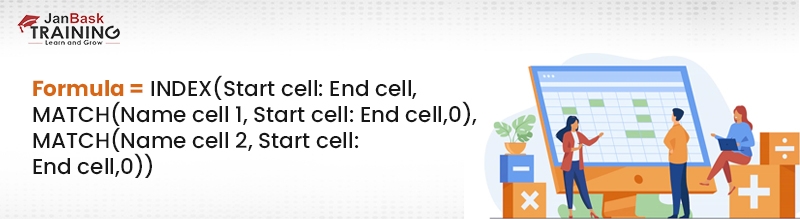
3. INDEX MATCH
This function in Excel functions list is an excellent alternative to the VLOOKUP or HLOOKUP Excel formulas which has certain drawbacks for performing research tasks. The INDEX MATCH is a combination formula of 2 separate functions:
INDEX: This formula returns the value of a cell in a table according to the column and row number.
MATCH: This formula returns a cell's position within a row or column.
4. AVERAGE
AVERAGE() concentrates on the calculation of the average of the selected range of cell values. As seen from the below formula, to find the avg of the total, you have to simply type in “AVERAGE(Cell 1, Cell 2, Cell 4)”.
It automatically calculates the average, and you can store the result in your desired cell.
5. SUBTOTAL
Let's move forward and figure out how the subtotal function works. The SUBTOTAL() function returns the sub-total to a database.
In the example above, we carried out the calculation of the subtotal on cells ranging from A2 to A4. As you can see, the function used is “=SUBTOTAL(1, A2: A4), in the subtotal list “1” refers to average. Thus, the above function will give the average of A2: A4 and the response to it is 11, which is stored as C5.
Microsoft Excel Formulas are used almost in every public or private enterprise. Especially in a career in data analytics. Check out this detailed guide to the Data Analytics Career Path to gain an in-depth understanding.
6. DATE
In the Excel formulas it's denoted =DATE(year, month, day). This formula will return a date that corresponds to the values entered in the parentheses — even values referred from other cells. For example, if A1 was 1999, B1 was 9, and C1 was 1, =DATE(A1, B1, C1) would return 9/1/1999.
7. ARRAY
A Array Excel functions list encloses a simple formula in adjoining characters using the format.t, {=(Start Value 1:End Value 1)*(Start Value 2:End Value 2)}. Pressing ctrl+shift+center will calculate and return the value from multiple ranges, instead of simply adding or multiplying individual cells.
In revenue calculations, it can greatly reduce your time and effort.
8. MODULUS
The MOD() function works by returning the rest when a given number is divided by a divisor. Let’s now have a look at the example below for a better understanding.
In this example, suppose we are dividing 30 by 3. The remainder is calculated using the function “=MOD(A2,3)”. The result is stored in B2. We can also directly type “=MOD(30,3)” as it will give the same answer.
In the Excel function list, this is very helpful for calculating income-based and data analytics operations. Check out the other 23 Smart Data Analytics Tools For Perfect Data Management
9. TRIM
The TRIM formula in the Excel formulas list is denoted =TRIM(text). This formula will remove any spaces entered before and after the text entered in the cell. For example, if A3 includes the name "John Mendis" with unwanted spaces before the first name, =TRIM(A3) would return "John Mendis" with no spaces in a new cell.
Instead of deleting and adding spaces if needed, you can clean up any irregular spacing using the TRIM function, which is used to delete additional spaces from the data (excluding unique spaces between words).
10. CHOOSE
This is an Excellent tool for scenario analysis in financial modeling. There are several options you can choose from and return the “choice” which you’ve selected. For instance, if you have three different values for income growth next year based on assumptions, using the CHOOSE function, you can return the amount as needed.
The formula is:=CHOOSE(Cell 1, Cell 2, Cell 3, Cell 4), here's a practical example below.
11. LEFT, RIGHT, MID
In this Excel function list, the LEFT() function displays the number of characters from the beginning of a text string. In the meantime, the MID() function returns the characters from the middle of a text string, with a start position and a length. Ultimately, the Right() function returns the number of characters from the end of a text string.
Let’s understand these functions with a few examples.
The usage of Excel formulas for quick work is not only limited to data analytics but also is widely used across SQL. So, if you are looking to start your career, Online SQL Certification is the way forward.
12. UPPER, LOWER, PROPER
The UPPER() function converts any text string to uppercase. In contrast, the LOWER() function converts any text string to lowercase. The PROPER() function converts any string of text into its case, i.e., the first letter of each word will be capitalized and all other letters will be lowercase.
Let’s understand this better with the following examples:
13. NOW()
The NOW() function in Excel gives the current system date and time.
Excel NOW returns the date and time of the day, continuously updated when a worksheet is edited or opened. NOW() does not take an argument. You can format the value sent back by NOW as a date, or as a date with the time by applying a number format.
14. XNPV and XIRR
For all analysts who come through investment banking, equity research, or any other area of business financing that requires refreshing cash flows, then these Excel formulas are sure to save you a lot of time.
For example, in this Excel formulas list, if you want to calculate the net present value (NPV) for any investment using a specific discount and cashflow rate occurring in irregular intervals, use the following function =XNPV(discount rate, cash flows, dates)
On the other hand, the XIRR function informs you about the internal rate of return (where output = input) for a series of cash flows arising at irregular intervals, such as =XIRR (values, dates, [guess])
15. RANDBETWEEN
This function allows the selection of a number within a predefined range of numbers on a random basis.
Once you have placed the lowest and highest numbers in the formula, Excel can select the correct data in the fields to which the names in Range are attached and randomly pick from them. The method for the scenario is: =RANDBETWEEN(starting point, ending point)
If you are thinking about how to use excel formulas? And want to know how Excel Formulas are used in IT companies. Begin with how to do data manipulation of packages using R?
16. CEILING
Then we have the ceiling function. The CEILING() function rounds a number to its nearest significant multiple.
For i.e, The nearest highest multiple of 5 for 45.316 is 50.
17. CONCATENATE
This function merges or joins multiple text strings in a single text string. The Excel CONCATENATE concatenate (join) function gathers up to 30 values and returns the result in text form.
The Excel formula is =CONCATENATE (text1, text2, [text3], ...)
18. LEN
The LEN() function returns the string's total character count. This will count global characters, including spaces and special characters. The syntax is =LEN (text). Given below is an example of the Len function.
=Len(Excel) the answer will be 5
Let’s now move on to the next Excel function on our list of this article.
19. FLOOR
In contrast to the Ceiling function, the floor function rounds a figure to the nearest multiple of meaning.
For i.e The nearest lowest multiple of 5 for 45.316 is 45.
20. REPLACE
As its name implies, REPLACE() works by replacing the part of a text string with another text string.
The syntax is =REPLACE(old_text, start_num, num_chars, new_text).Here, start_num refers to the position of the index with which you want to begin typing. Next, num_chars indicate the number of characters you want to replace.
Let’s now move to our next function.
21. POWER
The "Power()" function returns the result of a large number to a certain power. Let's take a look at the following example:
As you can see above, to find the power of 10 stored in A2 raised to 3, we have to type = POWER (A2,3). This is how the power function works in Excel.
Excel and Data Science are a powerful combination, especially for beginners. Take a look at the best Data Science Certification Course to boost your career.
23. SMALL
The SMALL function in Excel returns numeric values according to the position of the value in a list that is ordered by its importance. This function allows the retrieval of the "nth smallest values" of an array or a range of cells as the smallest value, the second lowest value, the third lowest value, etc
The Excel formula is=SMALL (times, range)
Since the SMALL function is automatic, you must provide a range and an integer for ‘nth' to specify the categorized value. The official names for this argument are ‘array’ and ‘k’.
22. SUBSTITUTE
The SUBSTITUTE() function changes the existing text to a new text in a text string. The formula is =SUBSTITUTE(text, old_text, new_text, [instance_num]). In this case, [instance_num] returns the current text index position more than once.
Here is an example of this function: Suppose, we are substituting “I like” with “She likes” by typing =SUBSTITUTE(A20, "I like", "She likes"), and the result is “I like” is replaced with “She likes”
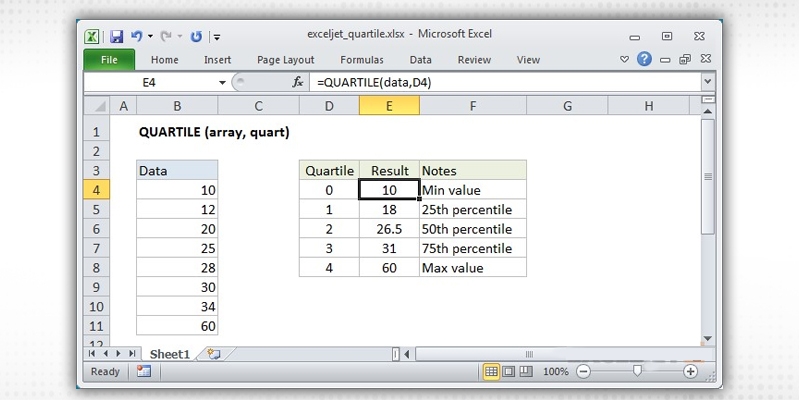
24. QUARTILE
In this Excel formulas list, this returns the quartile (each of the four equal groups) into a given dataset and can return the minimum value, first quartile, and second quartile maximum value. This function brings the quartile quantity of fields into an array. The function returns a numeric value based on the required percentile.
The Excel Formula is=QUARTILE (array, quart)
Also, if you have just completed your 12th in Science. Here are the top Professional courses after 12th science that you can choose.
25. OFFSET COMBINED WITH SUM
By itself, the OFFSET function may not be practical, but in combination with other services, you can get a complex formula with faster results.
If you would like to create a dynamic role that can add any variable number of cells, the regular SUM formula, which is static needs to be combined with the OFFSET function.
So for finding out the sum of values in variable cells, the formula should be =SUM(Start Cell: OFFSET(Start Cell,0, End Cell))
26. IF AND
This formula is practical in situations where you need to create some conditions to comb through a stack of data. The IF statement helps to use the Advanced Excel IF function to create a new field based on these conditions on an already existing track.
For example, if you want to mark the employees with salaries above 60K and employee ID greater than 5, then the formula will be: IF(AND(E4>5, F4>60000)1,0)
Since there are no real cases in the above data, the formula would return the value 0.
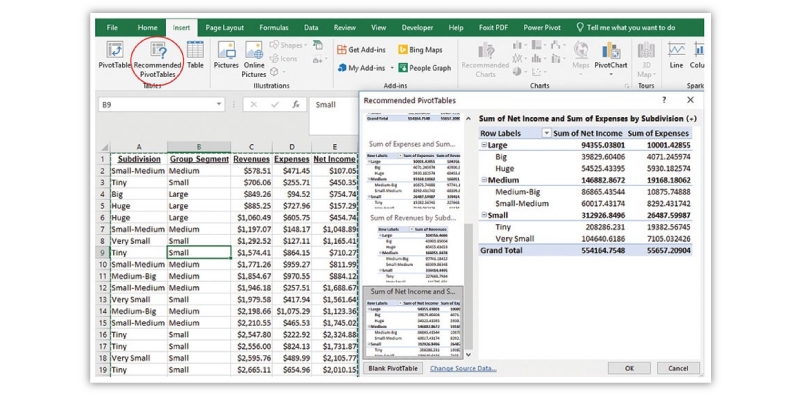
27. Pivot Tables
Pivot tables in Excel are a versatile tool that enables users to summarize, rearrange, sort, count, group, and calculate data effectively. They offer the ability to transform columns into rows and vice versa, providing flexibility in data presentation. By leveraging pivot tables, users can consolidate and analyze data from large spreadsheets, presenting it in a condensed and summarized format within a new table. This functionality empowers users to gain valuable insights and efficiently perform calculations on their data, enhancing data analysis and decision-making capabilities. Click here to learn more about how to perform a pivot on multiple columns.
28. Pivot Table Slicers
Slicers contribute to a more user-friendly and efficient data navigation experience within pivot tables. Slicers in pivot tables offer a user-friendly way to display and filter data selectively. Instead of traditional drop-down menus, slicers provide visually appealing buttons allowing users to hide or show specific data elements quickly. By interacting with slicers, users can dynamically control the visibility of data within the pivot table, enhancing the overall user experience. This intuitive feature simplifies data exploration and analysis, making it
convenient to focus on specific data subsets and quickly uncover insights.
29. Macros
Macros in advanced Excel functions are user-defined commands that can be saved and executed automatically whenever needed. They provide a way to automate repetitive tasks and streamline processes. For example, you can create a macro to generate a customized table from your accounts receivable data, applying specific criteria such as date restrictions and formatting rules to highlight overdue payments in red. By understanding macro definitions and utilizing macros, users can save time and effort by eliminating the need for manual, repetitive actions, allowing for more efficient data processing and enhancing the overall productivity of Excel workflows.
30. Flash Fill
Flash fill-in Excel is a time-saving feature that enables users to fill out information rapidly by detecting patterns in the data. It is beneficial for tasks such as splitting first and last names from a single column or merging them from two separate columns. When Excel recognizes a pattern, flash fill automatically populates the remaining data. With flash fill, users can avoid manually entering or manipulating data, improving efficiency and accuracy. By harnessing the power of flash fill, Excel simplifies data transformation and enhances productivity in data management tasks.
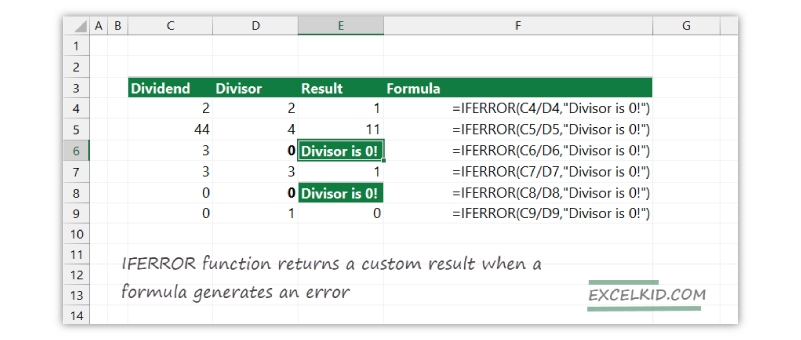
31. IFERROR
IFERROR is a valuable error-checking function in Excel that explicitly addresses situations where formulas yield errors. It is a straightforward and effective method for detecting and handling formula mistakes. By using IFERROR, you can define a desired value to be displayed if a formula produces an error, ensuring that erroneous results are managed appropriately. On the other hand, if the formula is error-free, IFERROR returns the calculated result as per the formula's logic. This function simplifies error management, enhances data accuracy, and facilitates a smoother workflow by proactively allowing users to handle and display custom messages for formula errors.
32. TYPE
The Excel TYPE function is a handy tool when working with spreadsheets created by others. It assists in determining the category of data present. Using the TYPE function, you can obtain a numeric value corresponding to the data's specific category. There are five categories: number (represented by 1), text (represented by 2), logical (represented by 4), error (represented by 16), and array (represented by 64). This function enables users to efficiently classify and analyze data based on its type, data validation rules, troubleshooting, and ensuring accurate data processing within Excel.
33. Workbook
A workbook in Excel refers to a compressed file that contains multiple spreadsheets. It is a convenient and organized approach to storing and managing related spreadsheets in one central location. Using workbooks allows users to keep their spreadsheets well-organized, easily navigate between different sheets, and establish efficient workflows. Understanding how to work with workbooks is a fundamental skill in Excel that proves valuable in various entry-level positions. Whether it's consolidating data, creating reports, or analyzing information, working with workbooks is an essential skill that enhances productivity and promotes effective data management in Excel.
By enrolling in data management courses you can master database fundamentals, gain industry knowledge related to handling databases and much more.
Five Time-saving Ways to Insert Data into Excel
During data analysis, there are five common ways to insert basic Excel formulas. Each strategy comes with its own advantages. Let's take a look at them.
1. Typing a Formula Inside The Cell
Typing a formula in a cell or the formula bar is the simplest way to insert basic Excel formulas. The process generally begins with an equal sign, followed by the name of an Excel function.
However, do not press Enter Key after you have made your selection. Instead, press the Tab key, and Excel will automatically complete the function name.
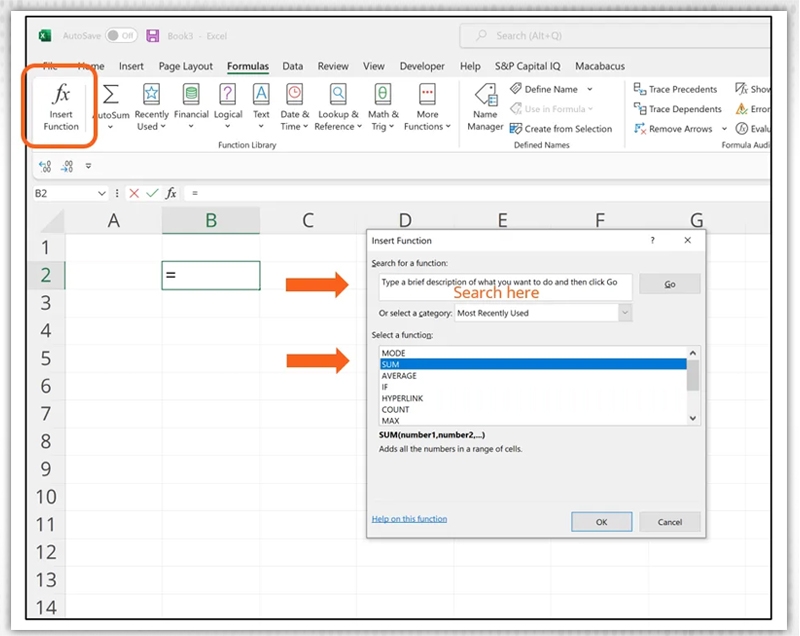
2. Using Insert Function from Formulas Tab
If you want total control to insert your function, use the Excel Insert Function dialog box. To do this, go to the Formulas tab and select the first menu entitled Insert Feature. The dialogue box will contain all the functions required for financial analysis.
3. Select a Formula from One of the Groups
This option is for those who wish to dive into their preferred features quickly. To locate this menu, go to the Formulas tab and choose your preferred group. Click to show a sub-menu filled with a list of functions. From there, you can select your preference.
4. Using AutoSum Option
For fast and daily tasks, the AutoSum feature is your favorite option. Navigate to the Forms tab and select the AutoSum option. Then click the insert sign to reveal other hidden formulas. This option is also available in the Home tab.
5. Use Recently Used Tabs
If you find that entering your latest form is a monotonous task, use the Recently Used selection. It’s on the Formulas tab, a third menu option just next to AutoSum.
Excel is a widely used tool across industries if you are interested in a career in programming. Check out our Programming Certification Courses to gain a complete insight into the domain.
Pro-tips For Working With Microsoft Excel
Now that you have learned the basics and the best excel formulas here are a few quick tips to enhance your art of excel.
- Always save the workbooks with backward compatibility in your mind. If using the above functions in higher versions of MS Excel, ensure that you save your files in 2003 format *.xls to maintain backward compatibility.
- Always use descriptive names to indicate columns and worksheets in a workbook.
- Try to avoid complex formulas with multiple variables. Instead, always break them down into smaller, more manageable outcomes you're building.
- Try to use the predefined functions rather than writing your formulas unnecessarily.
Conclusion
Excel is a very powerful spreadsheet application for analyzing data and generating reports. After reading this blog you would have learned important Excel formulas and functions that will help you perform your tasks better and faster. We've looked at advanced numerical, textual, data, and Excel formulas and functions.
1 out of 8 people worldwide use Excel, so it goes without saying that knowledge of Excel goes a long way in shaping many careers. Further, if you want to know which are the right Online IT courses, take a look at our courses at JanBask Training.
Do you have any questions related to this blog on Excel Formulas? If yes, then please let us know in the comments section of the blog. Our team of experts will help you solve your queries right away.
FAQs On Excel Formulas & Functions
Q1. How do Excel formulas help in analyzing data?
Ans- MS Excel is one of the most commonly used tools for data analysis. Most data analysts rely on Pivot tables for the statistical data. Excel helps in faster and simpler data analysis and provides high-level visual summaries, trends, and patterns.
Q2. Is Excel necessary for Data Science?
Ans- Excel is necessary for data scientists and is considered a base structure for intelligent data. Excel is a smart way to extract insights from data. The basic data analysis tasks are performed in Excel. Excel is used by beginners as well as by experienced Data Scientists in their workplace.
Q3. How can I learn Data Science & is Excel useful here?
Ans- You can learn Data Science through our online Data Science certification course that will give you practical learnings from basic to advanced Data Science methods with R & Python, machine learning, AI, deep learning, Big Data Hadoop, and Tableau Data Visualization in complete depth. Our Data Science certification training lets you master the concepts of Data Science & Excel-based real-life industry cases increasing your job market value.
Q4. What skills will I learn in a Data Science course?
Ans- In the Data Scientist course, you will learn R programming, Python, machine learning, Excel formulas, deep learning, regression analysis, data architecture, visualization techniques, risk analysis, process improvement, systems engineering, and many more concepts that are important for the Data Scientists certifications exam and to be an industry-ready professional.
Q5. What is the objective of these Data Science courses in Excel?
Ans- To provide a virtually accessible Data Science course that is similar to the offline classroom session and redeems you from the burden of traveling exhaustively - to help you grasp the Data Scientist demand skills/knowledge around R programming, Python, Data mining, machine learning with R, data visualizations, etc. via live coding with mentors and real industry case scenario assignments.
Q6. Is there any difference between Data Science and Data Analytics?
Ans- Data Science is a broad field that deals with extracting meaningful information through algorithms, statistics, and scientific methods. It is related to Big Data and is considered to be one of the most in-demand skills. Data Analytics is a branch of Data Science and is used to get conclusions by processing raw data.
Q7. What are the important skills required to become a Data Scientist?
Ans- To pursue & apply for the Data Science/Scientist job, you are required to specialize in the following technical skills:
- Great programming skills around Python, R, and SQL
- Understanding of statistics
- Data extraction, transformation & loading
- Data wrangling
- Machine learning & its algorithms
- Advanced machine learning - deep learning
- Data visualization & communications
Q8. Which Data Science certifications are in demand?
Ans- The few in-demand Data Science Certifications which you can think of achieving after completing our intensive & real-industry assignments based on Data Science training are:
- Apache Hadoop certifications
- Certified Health Data Analyst
- Data Science EMC Proven Professional
- IBM Cognos Business Intelligence certifications
- Microsoft Certified Solutions Associate
- Microsoft Certified Solutions Expert
- Oracle Database 11g Administrator Certified Associate
Q9. What can I expect after the certification program?
Ans- After completing our Certification training, you will have:
- Competent skills & knowledge that is ready to be applied over the certification exam of the course and even go for Microsoft Excel Certification.
- Intellectual ways to penetrate the in-demand job roles.
- A Training Certificate by a highly acclaimed name in the e-learning world, “JanBask Training,” - marking as proof of the successful completion of your learning-filled training journey
Q10. Do you help with job placements?
Ans- At JanBask Training, with our Data Science training, we expose you to the real-time industry’s job market scenario with available facts & numerical figures. We serve you knowledge on the actual scenarios of the data concentric industries/companies, their peak hiring hours, their hiring pattern, and everything that could support you in achieving those great job opportunities quickly. Along with certification examination preparation, we deliver you smart ways on how you can be a part of the job market with ease.
Trending Courses
Cyber Security
- Introduction to cybersecurity
- Cryptography and Secure Communication
- Cloud Computing Architectural Framework
- Security Architectures and Models
Upcoming Class
33 days 18 Jul 2026
QA
- Introduction and Software Testing
- Software Test Life Cycle
- Automation Testing and API Testing
- Selenium framework development using Testing
Upcoming Class
4 days 19 Jun 2026
Salesforce
- Salesforce Configuration Introduction
- Security & Automation Process
- Sales & Service Cloud
- Apex Programming, SOQL & SOSL
Upcoming Class
7 days 22 Jun 2026
Business Analyst
- BA & Stakeholders Overview
- BPMN, Requirement Elicitation
- BA Tools & Design Documents
- Enterprise Analysis, Agile & Scrum
Upcoming Class
11 days 26 Jun 2026
MS SQL Server
- Introduction & Database Query
- Programming, Indexes & System Functions
- SSIS Package Development Procedures
- SSRS Report Design
Upcoming Class
11 days 26 Jun 2026
Data Science
- Data Science Introduction
- Hadoop and Spark Overview
- Python & Intro to R Programming
- Machine Learning
Upcoming Class
19 days 04 Jul 2026
DevOps
- Intro to DevOps
- GIT and Maven
- Jenkins & Ansible
- Docker and Cloud Computing
Upcoming Class
3 days 18 Jun 2026
Hadoop
- Architecture, HDFS & MapReduce
- Unix Shell & Apache Pig Installation
- HIVE Installation & User-Defined Functions
- SQOOP & Hbase Installation
Upcoming Class
4 days 19 Jun 2026
Python
- Features of Python
- Python Editors and IDEs
- Data types and Variables
- Python File Operation
Upcoming Class
5 days 20 Jun 2026
Artificial Intelligence
- Components of AI
- Categories of Machine Learning
- Recurrent Neural Networks
- Recurrent Neural Networks
Upcoming Class
4 days 19 Jun 2026
Machine Learning
- Introduction to Machine Learning & Python
- Machine Learning: Supervised Learning
- Machine Learning: Unsupervised Learning
Upcoming Class
11 days 26 Jun 2026
Tableau
- Introduction to Tableau Desktop
- Data Transformation Methods
- Configuring tableau server
- Integration with R & Hadoop
Upcoming Class
4 days 19 Jun 2026
 May 20, 2025
  7.5k
7.5k


 May 15, 2018
 715.8k