
 Feb 07, 2020
  3.9k
3.9k

06
SepDon’t Miss Out : Join our live webinar on AI in Test Automation - Register Now
In this article, we are going to talk about what is a parameter in Tableau and how we can use that parameter to make a report dynamic. We will also talk about how to create parameters in Tableau and use those parameters in the reports. At the end of the article, we will see how you can use that parameter in the filter to control the report and it will be followed by an assignment.

A parameter is a value that we pass to a program to customize the report for a specific need. The parameter can be anything like -
Parameter helps you allow you to provide a value that will be passed in tableau. It is an asset that makes the dashboard dynamic. The best thing about the parameter is you can create a parameter and use that parameter at several places. Also, the parameter can have almost all the major data types.
Example
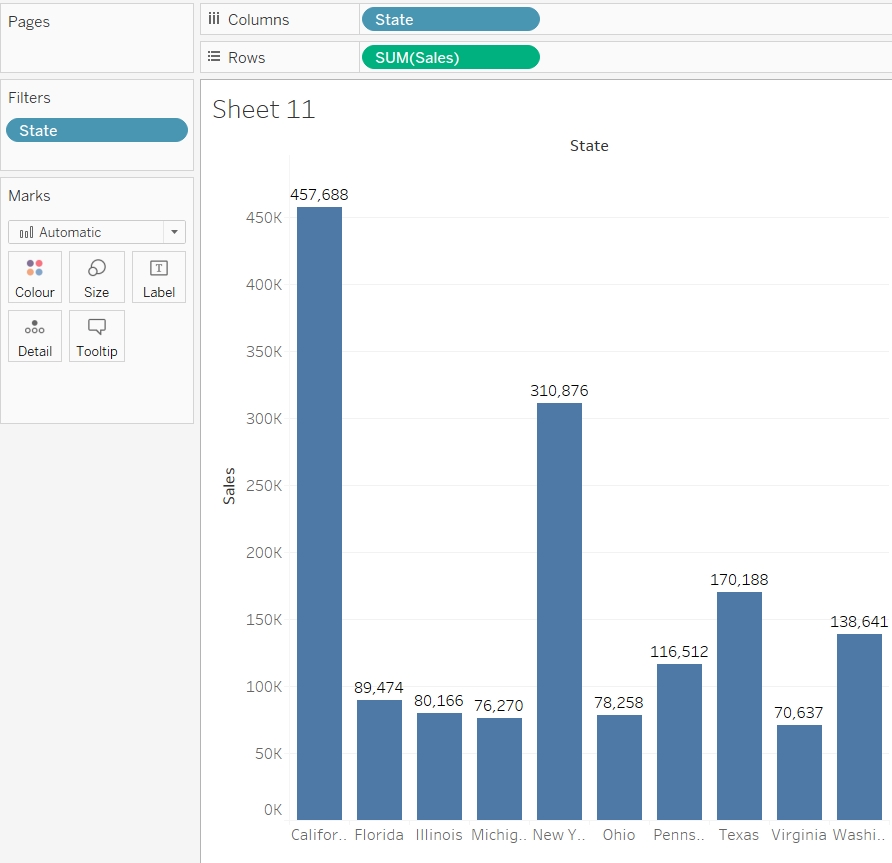
Let's create a report which will show the top five states based on sales. To create this report, we will use the State dimension in the column shelf and sales measure to the row shelf.
Now to filter this report to show the top 5 states based on the sales we need to use states in the filter self. If you are not comfortable using filters, I recommend you go through the filter article first and then come back over here.
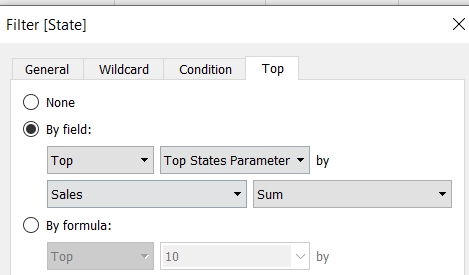
Once you drag the state dimension into the filter self you will get a pop-up option. In this option go to the last tab called top. Here select by a field radio button. And as we need the top 5 states to change the value 10 to 5. Also, as we need to filter the states based upon the sales done in the justice so we need to select the sum of Sales as well.
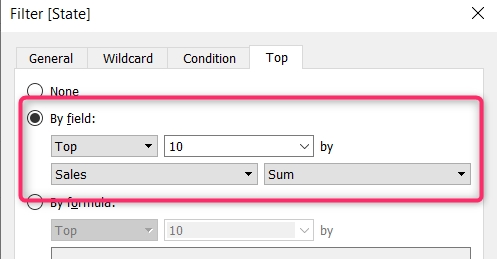
Once, all these details are verified click the OK button and you will find only 5 states is shown in the reports where you have received the maximum sales.
Now if you want to change this report to show only the top three states based upon the sales for the top 10 states based upon the sales you will have to edit the filter and select the required number into the filter section.
Similarly, if you have to show the bottom states like the top five bottom States or top 10 bottom States based on the sales you will have to make changes in the report just by going through the filter option.
Read: How to Interact with the Content on the Tableau Server?
In all these requirements, for every change, we have to go to the filter option to change it as expected. But think of the situation when you have published this dashboard to the tableau server and users want to see some time top 5 report while other Times top 10 reports. As all the time developers won't be available to make the changes and so there should be a provision using which users will be able to see the changes on their own.
One of the easiest ways to do this is by using a parameter in tableau. Parameters help you allow the users an option to look for what about top or bottom numbers they are looking to see.
In the next section, we are going to see how we can create a parameter in tableau and will use that parameter to control this dynamic nature of this filter.

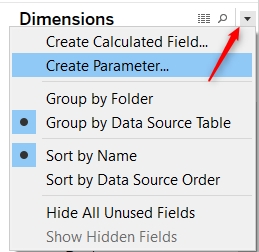
To create a parameter in tableau, click on the icon showing you at the right of the dimensions. From those options select create parameter.
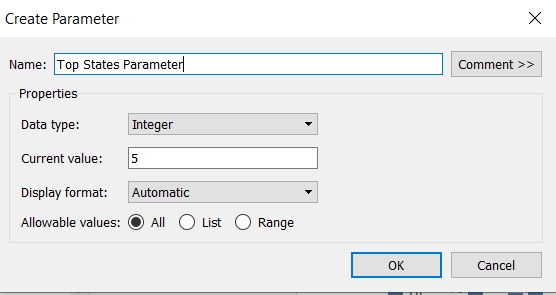
Here you will get a pop-up option that you need to customize to create the parameter.
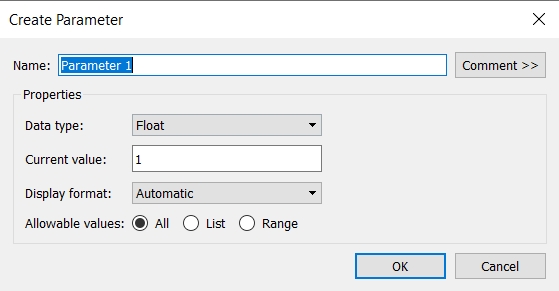
The first option here is the name of the parameter. By default, some numbers followed by parameter will be selected over here. You should divide a valid name into the parameter.
After that, there is a button for comments. Commenting in the parameter is an optional step where you can write the details like why you created this parameter and several other things. Although, the comment is an optional field while creating the parameter but you should leave this option as a best practice.
The next section is for properties and this is the main section through which you are going to decide what kind of parameter you will be creating.
In the properties section, the first field is for the data type. There will be multiple data types listed over here those can be a float, integer, Boolean, String, Date, and DateTime. Now depending upon your requirement you can select any of these data types for the parameter.
For example, As I have to show some top States or bottom States based upon the sales and top and bottom can be a number which will be nothing but the integer and so selecting integer as the data type for this particular requirement.
Read: Tableau Tutorial for Beginners: A Complete Guide
Tableau Online Training & Certification

The next field in this properties Section is for the current value. By default, 1 will be listed over here. The current value says what will be the value by default when the user will access this report where this parameter has been used. For our simplicity let's make this 5. That means when we will be using this parameter in the report by default top 5 or bottom 5 states will be shown. Now whether the report will show the top or bottom that depends on what option you have selected in the filter.
The next option in the section is the display format. There are multiple options for this and these options vary depending upon the data type you have selected in the above dropdown. Unless required keep this automatic.
And the last option in this section is allowable values. Here you will be having three different radio buttons. All means users are independent to put any values. If you are selecting a list then you will have to provide what all options users should have. And using the third radio button which is the range you can provide some specific range between which user will be able to select the values.
For example, if you have provided the range between 5 to 10 then the user will only be able to select any number between 5 and 10.
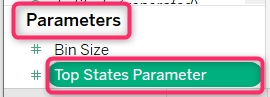
For this example, I am going to allow all values. Once done just click ok and you will find a separate section has been created four parameters and your parameter will be listed in that section.
In the Data tab, you will find a section for parameters where your newly created parameter will be listed.
Now we are going to use this newly created parameter in our existing report where we were creating top States based on the sales.
To do that go to the state filter again and edit it. Now click on the dropdown where you have written top 10 and you will find your newly created parameter listed over there. You can even create a new parameter from here also. Just select the parameter that we have created in the last section and click ok.
Read: What is Group and How to Implement Grouping in Tableau?
You will find your report has been filtered for the top five states only. Our aim was to provide this option to the user where users can select how many top States they want to see in the report and so we need to enable this option.
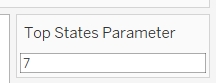
To do that just right click on the parameter and select show parameter control. Now you will find the parameter has been shown at the top right of your window. Just put the required value as you want and you will find your report getting changed according to the value you have selected for the parameter.
You can also format this parameter like you can change the name of this parameter change the title of this parameter and even the way it is being displayed. Although the blue highly depends on the display you have selected but you can customize it as per your requirement.
This way, you can make your report dynamic and allow the user to have an option you top or bottom numbers as they want.
Tableau Online Training & Certification

This is all about what is a parameter in Tableau when we should use the parameter in tableau, how to create a parameter, and how to use that parameter in the filter. A parameter is an independent dynamic control in tableau and so you can use this parameter at other places as required.
Some of the common places where parameters can be used are in the calculated field while creating the bins etc.
When you create a report which consists of Bin, you can use the parameter to control the size of the bin. Now try creating the parameter and use that parameter in the report which should show the bottom and the N States based on the quantity. Here N should be controlled by the user.
 FaceBook
 Twitter
 LinkedIn
 Pinterest
 Email
Email
The JanBask Training Team includes certified professionals and expert writers dedicated to helping learners navigate their career journeys in QA, Cybersecurity, Salesforce, and more. Each article is carefully researched and reviewed to ensure quality and relevance.


Cyber Security

QA

Salesforce

Business Analyst

MS SQL Server

Data Science

DevOps

Hadoop

Python

Artificial Intelligence

Machine Learning

Tableau
Search Posts
Related Posts
Receive Latest Materials and Offers on Tableau Course
Interviews


 Jan 04, 2022
 4.7k
4.7k

 4.7k
4.7k