Introduction
So, what is debugging? Or what is debugging in programming? These are some of the questions that initially come to our minds while we think of delving deep into the topic. Well Debugging is often considered an unsung hero of the software development world. But coding has a debugging role. It’s all due to us and the hype we create. No doubt, coding consumes a significant amount of time for developers, but no code performs seamlessly in one go, and that’s where debugging comes into play. But, still no body knows what is debugging in programming.
Software bugs are inevitable. They creep into our code, causing developers crashes, errors, and headaches. So, understanding the concept of debugging can transform these challenges into opportunities for growth and improvement
In this comprehensive guide to debugging, we’ll explore its importance, challenges, and some effective strategies that will foster your skills in the market. Whether you're a seasoned full-stack developer or an aspiring developer, this guide will provide insights, strategies, and practical tips to become a debugging expert.
What Is Debugging? Why It’s Important?
When someone asks or searches what is debugging in programming, many need clarification with its technical definition. So, let’s get it this time in layman's terms, about what is debugging means, it simply means removing all the bugs from our products that prevent them from performing better.
In the software world, especially in the world of programming languages, debugging detects and removes all potential errors from the code. These bugs are potent to cause crashes and create difficulties in performance. The debugging process aims to find and resolve bugs or detect defects to prevent incorrect software functioning. When the different subsystems or modules are tightly occupied, debugging becomes difficult because changing in one module can cause more bugs. That’s why debugging the program sometimes takes more time than coding.

Why Debugging Is Important?
After knowing what does debugging mean in coding, we can understand its importance in the programming world. But still, we have explained various reasons in detail to help you better understand debugging and its role.
Now, let’s take a look.
- Identify & Fix Bugs: We all know well what is debugging mean, so it’s obvious now it is all about finding and resolving the code errors. Such bugs can result in performance degradations, app crashes, or erroneous data, thus causing a user's frustration or dissatisfaction. It guarantees that the program works as expected, extending reliability and user satisfaction.
- Improves Software Quality: Debugging takes center stage in the general software quality. The job of the QA testers is to detect bugs and eliminate them. Hence, stability is improved, security is increased, improving overall efficiency. Even now, the area of certifications of QA testing has existed for a long time, and it has been learned by anyone who wants to study the secret of debugging. They have specially taken the QA testing training to ensure the software performs optimally.
- Save Time & Resources: Debugging saves time and resources in the long run. When the bugs are depicted appropriately, the developer knows their place of origin. As a result, they can code better, in this case, avoiding the need for more code and rework.
- Enhance User Experience: Software is popular when it works correctly and does not have bugs. Debugging is critical because it allows software to be built to users' expectations and provide a great user experience.
- Maintaining Security: Bugs in software can sometimes lead to security vulnerabilities. Debugging helps identify and fix these vulnerabilities, making the software more secure. It is crucial for software that handles sensitive or confidential information.
- Increasing Developer Efficiency: Debugging can help developers become more efficient. By better understanding how code works and how to fix bugs, developers can write better code in the future and troubleshoot issues more quickly and effectively.
The Major Types of Debugging
Complex defects may take days to resolve, so different methods exist to tackle the problem. Below, we’ve listed the major types of debugging that’ll help you know the major types.
1. Build and compile time errors
As the name suggests, it occurs during the development stage or after the code is done. The compiler or interpreter detects the errors while building the source code. Build or compiler time errors prevent the application functions and don't even let them start.
These errors are usually due to syntax errors that include missing semicolons at the statement's end or the class we can't find. These errors are easily identifiable plus resolved quickly because most IDE or compilers will detect them for you. The compiler or interpreter will also specify the exact piece of code that is causing the problem.
2. Runtime Errors
These errors occur only when an application runs and the compiler or interpreter cannot identify them during the build stage. It even happens when the source code has no compiler or syntax errors. Typically, these errors depend on the user input or the environment. You can identify them using try-catch blocks in your program and adequately logging the error message.
3. Logic Errors
Now comes the time for logic errors after the program is successfully compiled and running, plus giving the output. The name itself suggests the kind of error it is. It usually occurs when the program result is incorrect. We can catch these bugs with the try-catch blocks.
Logic errors are also named semantic errors and occur due to faulty logic used by the developer to solve a problem during the application development.
So, these are the major debugging types that occur during or after the development. However, the solutions are also there, which we’ll discuss later in this blog.
QA Software Testing Training
- Personalized Free Consultation
- Access to Our Learning Management System
- Access to Our Course Curriculum
- Be a Part of Our Free Demo Class
How Does Debugging Work In Software?
Debugging software is not a piece of cake. It involves a systematic approach to identify and resolve the bugs. Every case is different, but below is the list of five major steps generally involved.
- Reproducing the Issue: The first part of debugging is recreating the issue. It includes testing the software in an isolated environment and executing all the actions or circumstances that cause the problem. To ensure this, the developers repeatedly try to reproduce the issue, which can make sure that they have worked on the same bug.
- Understanding the Code: With an issue being reproduced, the developers will need to go through the part of the code where the issue should have been corrected, and there are spots they think can take part in the problem. It would require syntax analysis, multiple code reads, data structures, and algorithm understanding.
- Identifying the Root Cause: Developers can then pinpoint the root cause after they master the code's workings. It would imply the tracking of the code execution to single out the main occurrence reason and place. Identifying the core problem is a common process involving debuggers, logging statements, and code reviews.
- Fixing the Bug: When the root cause is found, the developers eliminate the flaw. This could translate to rewriting the code, improving the logic, or upgrading the data structures. It is critical to check the change to ensure it fixes the problem without causing additional issues.
- Testing the Fix: Testing is completed after the bug is resolved, thus making sure that the problem is solved. It could be accomplished by either running automatic tests, manual testing, or a blend of both. The aim is to determine if the change works well enough and does not lead to regressions.
A software problem can be effectively debugged by applying the five techniques above, and the users would not have to face any technical issues after accessing the developed software. Debugging is a skill that the developers ought to have and is very helpful in keeping the software systems working.
Also, read this blog to know how to output the debug samplers. Click here
Debugging Vs. Testing- Know The Major Difference
When discussing what is debugging mean, we mean identifying and resolving errors. That’s why it’s often being confused with testers. To clarify this, we have compared both to make you understand the two better, and for better understanding, check out this blog about debugging and testing.
|
Aspect
|
Debugging
|
Testing
|
|
Purpose
|
Identify and fix bugs in the code.
|
Verify that the software meets requirements and functions correctly.
|
|
Timing
|
Performed after the code is written.
|
Performed after debugging and before deployment.
|
|
Focus
|
Isolating and resolving specific issues.
|
Checking the overall functionality of the software.
|
|
Process
|
Analyzing code, identifying bugs, and fixing them.
|
Creating test cases, executing them, and comparing actual and expected results.
|
|
Tools
|
Debuggers, logging, and monitoring tools.
|
Testing frameworks test automation tools.
|
|
Goal
|
Ensure the software is free of bugs.
|
Ensure the software meets quality standards.
|
|
Outcome
|
Bug-free code.
|
Verified functionality and quality assurance.
|
Therefore, debugging focuses on bug identification and fixing, while testing concentrates on demonstrating the software functioning that should meet the requirements and planned goals. Both are crucial in identifying the software quality and reliability.
Know The Top Debugging Tools Of The Market
After knowing what is debugging mean or what is debugging and understanding the major difference between debugging and testing, it’s time to know the top debugging tools you should look for. Here’s again a list stating the names and major features of the popular debugging tools. Let’s take a look.
- Visual Studio Debugger: A powerful tool for debugging code written in various languages, including C#, C++, and JavaScript. It offers many features, including breakpoints, watch windows, call stacks, and variable inspection.
- GDB (GNU Debugger): A widely used debugger for Unix-like systems that supports multiple programming languages, including C, C++, and Fortran. It allows developers to inspect and modify the state of a program, set breakpoints, and analyze memory and registers.
- LLDB (LLVM Debugger): A debugger known for its speed and lightweight design. It provides features like breakpoints, watchpoints, and expression evaluation, commonly used with the Clang compiler.
- Chrome DevTools: A set of web development tools built into the Google Chrome browser, including a JavaScript debugger. It allows developers to debug JavaScript code running in the browser, inspect the DOM, and analyze network activity.
- Firefox DevTools: Similar to Chrome DevTools, offers web development tools built into the Mozilla Firefox browser. It includes a JavaScript debugger, DOM inspector, and network analysis tools, useful for debugging web applications.
- Xcode Debugger: A debugger included in Apple's Xcode IDE, used for developing macOS, iOS, watchOS, and tvOS applications. It provides a range of debugging features tailored for Apple platform development, such as breakpoints and variable inspection.
- Eclipse Debugger: Integrated into the Eclipse IDE, widely used for Java development and supporting other languages through plugins. It offers a user-friendly interface for debugging, including features like breakpoints, variable inspection, and step-through debugging.
Also, Understand The Top Debugging Methods To Fix Bugs & Errors
Now, we know well what does debugging mean in coding. But still, we don’t have the major tricks and methodologies to tackle the bugs issue. As explained above, there are various types of errors, and you may still not know exactly what to do to resolve the errors. We have got the answer to this, too, and listed out the top debugging methods you can use to solve the bug. Let’s also understand these methods once.
1. Log analysis
The first methodological approach that a software developer employs while debugging is putting some log analysis statements in the strategic places within the lines of code, which can be helpful to you when it comes to isolating and fixing problems. A statement like this is a message your code writes out into a log file that you can later analyze to get deeper insights into how your program was running and what values variables were assuming at various instances.
Looking through these log statements carefully will help you find exactly where our code has gone wrong. This makes troubleshooting faster and easier for developers because they can quickly identify issues before they become critical.
Several good log analysis tools can make this process even more accessible, such as Sematext Logs, SolarWinds Loggly, and Splunk, with an advanced feature enabling quick parsing of large amounts of data logs simultaneously to extract relevant information from them. Utilizing any or all these tools while coding will save you so much time and effort during this debugging process, ensuring that quality software products reach your end user.
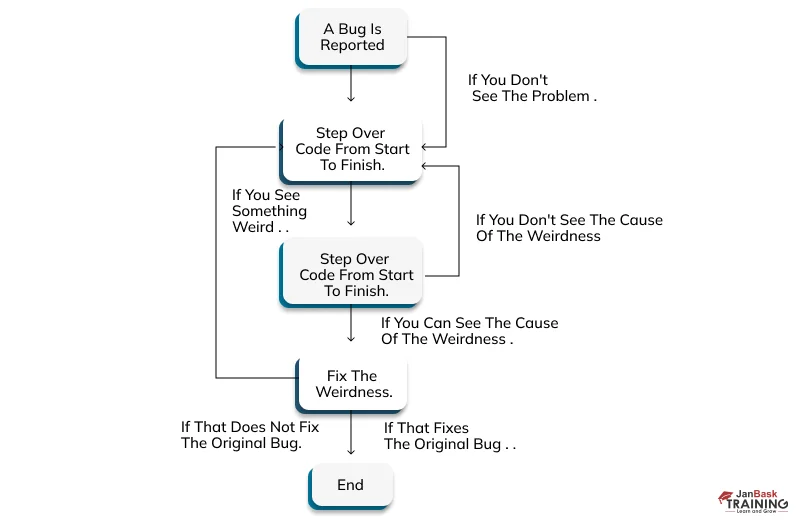
2. Brute Force Method
The most common debugging method is brute force. However, it is known for its unorganized and unstructured approach to resolving software bugs. That’s why it’s considered least efficient, but developers still follow this method and step through it to fix bugs when left with no option.
The graph below represents its general process.
There's no defined procedure for debugging. Developers sometimes solve bugs randomly or arbitrarily until they discover a viable solution. It may also sound uncoordinated because developers often resort to the following techniques.
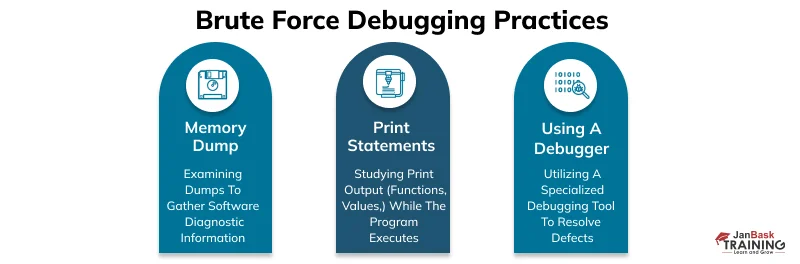
Memory dumps help analyze bugs better because they contain information on system states and memory contents. However, the massive data amounts make finding the right way time-consuming. Many consider using here the print statements. It's a sophisticated technique that better shows the program dynamics, making them easier to read.
The process seems easy and helpful, but it's also essential to be cautious while using print statements because changing the code can conceal the bug. Never always rely on software testing tools. Rely on them sparingly because human skills and their thinking are always irreplaceable.
3. Bug Clustering:
You may encounter similar errors in your software, like your app crashing in several areas). While debugging, grouping these comparable bugs is useful—a practice called bug clustering.
The reasoning is simple, as you will quickly arrive at their resolution by examining related defects. Every bug in a cluster contains some clue to resolve the error causing that cluster.
Therefore, by analyzing each cluster’s characteristics, you should be able to arrive at the source of all these bugs. Then, once you have identified that source, you can resolve multiple errors with one simple bug fix. A single concentrated change in the code can fix an entire assembly of problems.
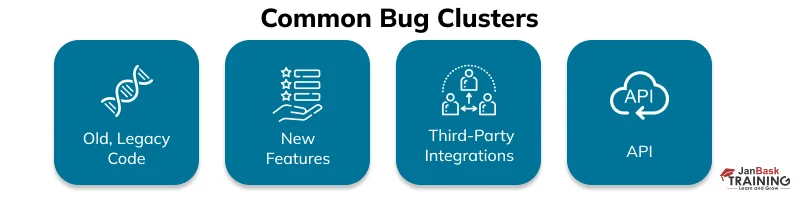
We have shown the most common varieties if you’re wondering what these clusters typically look like. Related bugs usually appear in one of these four areas due to being the most variable and dynamic codebase sections.
The two issues will likely be connected if your bug tracking integration is not saving defects and hosts unresponsive buttons. Similarly, too big images on your new login page might have something to do with the malfunctioning e-mail address autofill. Clustering similar defects together lets you assess and resolve your software’s errors more efficiently.
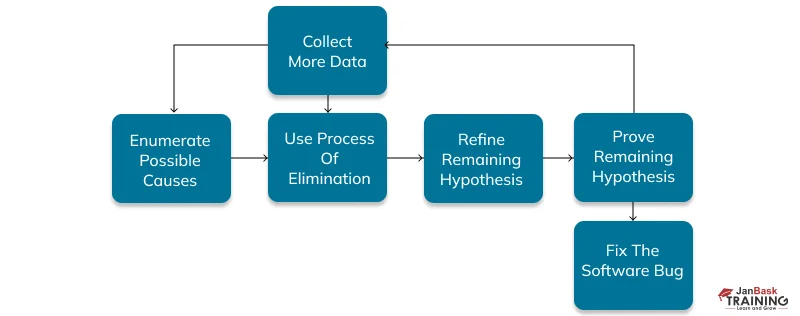
4. Cause-elimination method
The cause-elimination method is the most scientific debugging strategy or, we can say, a technique to resolve software bugs. First, you must list all the possible reasons for the detection. They are not necessarily should be entirely rationalized. Theories are also most welcomed and even considered better to assess the situation.
After this, test each hypothesis individually. As you analyze your codebase, you’ll eliminate possible causes as you go and leave with one sole possible reason. If the remaining theory is vague, it is time to refine it further. Now, you can prove it and solve the software bug better.
The image below pictures the process:
While eliminating potential causes, you might destroy them all. You’ll better power yourself with more data and devise extra theories. Also, if you cannot prove your hypothesis, you’ll have to examine the codebase again.
Although the method requires some preparation (noting the list of theories, testing them, etc.), this extensive, structured groundwork pays off later, assuring better speed. With so many options and all the details laid out, the cause elimination method becomes the fastest debugging method.
5. Binary Search
Considering the complexity of a task, avoiding being bogged down in a huge challenge is essential. One way of doing this is by breaking it down into smaller, easier-to-manage parts. The idea behind binary search involves splitting the code in two and gradually narrowing down the place where the fault lies. Besides, you can use other ways, such as commenting out code, printing statements, or isolating components during debugging to identify the faulty segment quickly. Through these techniques, one simplifies the fixing process, hence saving time and energy.
6. Rubber Ducking
On several occasions, developers have found describing their problems to others helpful, even when they turn to nonliving things for help, like rubber duckies. This practice creates room for more profound thoughts regarding the issue, especially when one expresses himself verbally or through writing. During this process, developers may recognize an issue they could not see before and thus find new perspectives that will lead them toward possible remedies. When developers externalize a problem and move it beyond mere thinking, they gain fresh eyes on it, which often makes finding a way out easier than perceived.
7. Breakpoints & Stepping
Program debugging is an important part of programming. One very useful way to debug code is by setting breakpoints. Breakpoints are points in the program where execution stops temporarily, allowing the programmer to examine the program state.
A breakpoint is reached, and developers can use stepping to move through code one line at a time, hence investigating for problems with variables and data structures in it. This helps identify errors and pitfalls that may cause issues with your code. Therefore, developers can look into each line of their codes manually, analyze them thoroughly, and correct any malfunctioning parts.
8. Reverse Debugging
Reverse debugging, also called backtracing, refers to a powerful method of troubleshooting that entails pinpointing the source of the problem and then retracing how and why it happened in the first place using a process involving moving backward inside the reverse debugging control flow graph.
This is especially useful for intricate situations where, in the future, it becomes problematic. Onset and motion back lead developers along the path specified by executing code, enabling them to quickly detect the main point of failure.
9. Take Notes From Learning
At the beginning of the debugging, you should keep a log of your progress, and the solutions you find will help you when you return to the code. Although you may encounter debugging problems in the future, this documentation will be a helpful tool to turn to. Imagine it as your intermedial, an exhibit of your debugging progress, proof of the times you've grown and learned as a developer.
It would help if you didn't neglect debugging, as it is vital for your career, so be open to it as an opportunity to learn rather than a source of stress. With each debugging session through your journey as a developer, you can hone your skills and build up your problem-solving skills. Spotting patterns and pairing issues will become second nature; consequently, you will find debugging faster and easier in the future.
Bonus Tip:
Avoid leaving vulnerabilities in your code from the very beginning. Do it by planning things before you write your code. Decide what you want and how you wish to get it to design a clear algorithm. Ensure it is understandable to you and decide which data structures you'll choose and rules you'll follow. This planning is an insurance for you to spend less time and be more efficient when debugging in the long run.
So, all these are the common debugging methods. However, there are more that you can consider. These simpler ones will give you a raw idea about tackling the simpler or even complex bugs.
Also, if you have doubts about debugging in Java, then consider reading this guide-Debugging In Java.
Why should you learn debugging?
Debugging is always a crucial part of software development. So, learning debugging is quite helpful for software development developers, especially QA testers. They would be able to understand the significant intricacies of development and ensure optimal software performance if they knew both testing and debugging. Mastering the debugging techniques will make them provide better feedback to developers, resulting in quicker bug resolution and improved software quality.
Additionally, learning debugging will enhance career prospects because companies value candidates with strong debugging skills. So, let's begin with QA training for beginners and gain QA testing certification to validate your skills in the market and secure a good job.
Conclusion
Finally, we have reached the end of this blog. We guess now you have all your answers on what is debugging or what is debugging in programming and why should someone learn it today. We have learned the importance of debugging, and now you may know why debugging skills are vital today. There are various reasons to learn these skills, especially if you are a QA tester.
Take admission to the online QA testing certification program today!
FAQs
Q- What is debugging?
Ans- Debugging is identifying and correcting errors, commonly called software bugs, which are computer-readable text codes for the software to execute. It entails detailed code analysis, pinpointing the root of issues, and getting rid of the bugs.
Q- Why is debugging important?
Ans- Debugging is essential for the software development process as it aids in software quality improvement, creating a user-friendly interface, saving of time and costs, maintaining security, and increasing developers' efficiency. By detecting and eliminating bugs, the programmers can be sure that software works well and meets users' requirements.
Q- What are the most popular debugging approaches?
Ans- Common debugging techniques are stepping through the code in a debugger, inspecting variables and data structures, inserting logging statements for program execution tracking, and reviewing code to determine possible problems.
Q- What can I do to perfect my debugging abilities?
Ans- To enhance your debugging skills, spend daily on different types of projects, learn from experienced developers, use debugging tools efficiently, and develop a systematic approach to resolving problems.
Q- What debugging issues do we have to deal with?
Ans- Some debugging problems deal with complex bugs that are hard to reproduce; others involve managing time constraints and the risk of creating new bugs while fixing the existing ones. In addition, debugging the system with distributed networks or multithreaded applications is more arduous.
Q- Is debugging only a developer's task?
Ans- However, debugging is usually assigned to developers. Other team members, such as quality assurance testers and system administrators, can also understand debugging techniques. In this vein, the development relies on QA testers who utilize debugging abilities to offer necessary recommendations to developers and warrant software quality.
Q- What is debugging in programming? What role does debugging play in software testing?
Ans- Debugging is an essential part of software testing, as it helps identify and fix issues found during testing to ensure the software meets quality standards before release. It allows testers to verify that the software behaves as expected and to identify any deviations from the desired functionality.
Q- Can automated testing replace manual debugging?
Ans- While automated testing can help identify some bugs, manual debugging is still necessary for complex issues that require human intervention and analysis. Automated testing can catch certain bugs early in development, but manual debugging is often necessary to resolve more intricate problems.
Q – What are the debugging tools that developers commonly use?
Ans- Debugging tools that are widely used include IDEs with inbuilt debuggers, C/C++ program GDB, and logging frameworks like Log4j for Java applications.
Q- What is your approach for debugging when you are faced with a large complex codebase?
Ans.- A thorough examination of a complex source code should first decompose the problem into smaller, more manageable parts. This typically involves breaking down the issue to something smaller to reproduce it in a test case. Then, gradually increase the allowed scope until the root cause is found and fixed.
Q- What are the ways one can avoid these bugs from inception?
Ans - Developers can use best practices like writing concise and easily understandable code owing to version control systems that control changes, conducting code reviews, and using automated testing. One of the most common problems in debugging multithreaded applications is writing code in a non-thread-safe manner.
Debugging multithreaded applications is quite a task since it is subject to problems like race conditions, deadlock, and thread synchronization issues. Developers should employ specialized tools and techniques for multithreaded debugging to identify and fix such issues.
Q- What strategies can be implemented to debug issues in a production environment without interfering with services being rendered?
Ans - Debugging the problems in the production environment, developers can resort to log reading, monitoring tools, and remote debugging. It is crucial to thoroughly think out these debugging strategies and check them not to break users' experience.
Q- How do you go about debugging agile development?
Ans- In Agile development, testing and debugging are an integral part of the development process, with developers running tests and fixing bugs widely during the cycle iteration. This approach, in which bugs are found and resolved repeatedly, provides rapid identification and solutions, guaranteeing that the software meets quality standards.
QA Testing Course
Upcoming Batches
Trending Courses
Cyber Security
- Introduction to cybersecurity
- Cryptography and Secure Communication
- Cloud Computing Architectural Framework
- Security Architectures and Models
Upcoming Class
17 days 03 Jul 2026
QA
- Introduction and Software Testing
- Software Test Life Cycle
- Automation Testing and API Testing
- Selenium framework development using Testing
Upcoming Class
3 days 19 Jun 2026
Salesforce
- Salesforce Configuration Introduction
- Security & Automation Process
- Sales & Service Cloud
- Apex Programming, SOQL & SOSL
Upcoming Class
6 days 22 Jun 2026
Business Analyst
- BA & Stakeholders Overview
- BPMN, Requirement Elicitation
- BA Tools & Design Documents
- Enterprise Analysis, Agile & Scrum
Upcoming Class
10 days 26 Jun 2026
MS SQL Server
- Introduction & Database Query
- Programming, Indexes & System Functions
- SSIS Package Development Procedures
- SSRS Report Design
Upcoming Class
10 days 26 Jun 2026
Data Science
- Data Science Introduction
- Hadoop and Spark Overview
- Python & Intro to R Programming
- Machine Learning
Upcoming Class
18 days 04 Jul 2026
DevOps
- Intro to DevOps
- GIT and Maven
- Jenkins & Ansible
- Docker and Cloud Computing
Upcoming Class
2 days 18 Jun 2026
Hadoop
- Architecture, HDFS & MapReduce
- Unix Shell & Apache Pig Installation
- HIVE Installation & User-Defined Functions
- SQOOP & Hbase Installation
Upcoming Class
3 days 19 Jun 2026
Python
- Features of Python
- Python Editors and IDEs
- Data types and Variables
- Python File Operation
Upcoming Class
4 days 20 Jun 2026
Artificial Intelligence
- Components of AI
- Categories of Machine Learning
- Recurrent Neural Networks
- Recurrent Neural Networks
Upcoming Class
3 days 19 Jun 2026
Machine Learning
- Introduction to Machine Learning & Python
- Machine Learning: Supervised Learning
- Machine Learning: Unsupervised Learning
Upcoming Class
10 days 26 Jun 2026
Tableau
- Introduction to Tableau Desktop
- Data Transformation Methods
- Configuring tableau server
- Integration with R & Hadoop
Upcoming Class
3 days 19 Jun 2026
 Mar 01, 2024
  3.6k
3.6k


 Aug 23, 2024
 6.9k
6.9k