
 Mar 17, 2020
  5.1k
5.1k

04
JulMonth End Offerl : Get 30% OFF + $999 Study Material FREE - SCHEDULE CALL
- Data Science Blogs -
In most walks of life, we talk that I’m quite confident that this thing will happen or I’m quite confident about this. All of us at some point in time have been talking about this. If we look at statements made by us, it will be obvious to anybody that we are always certain with a degree of confidence in our statement. This statement is made in natural language and is quite vague if we can put a number to this, things will become more clear.
Now, let us say that we have a record of the number of times one made a statement like this was made. As soon as we start this process, we put a number and enter the domain of statistics. In the domain of statistics, it becomes possible for us to define the level of certainly using a number. This number can belong to a particular range. This range to which the number belongs can be said to be the confidence interval.
Technically speaking, a confidence interval is the measure of uncertainty in the data. These are widely used to depict how much confidence one can place in the outcomes reflected in the results of a poll or survey. Confidence intervals are connected to confidence levels due to their inherent nature.
Theoretically, the confidence interval is the range of values which have derived from a sample population and depict the behavior of an unknown sample belonging to the broader population group. As can be observed from the natural surrounding that No two groups are the same. Thus, if two different samples are taken from a single population they can also yield a difference in the range. But, if this process is repeated several times, some parts of the resulting confidence interval will be able to replicate the unknown behavior. The percentage is known as the confidence level.
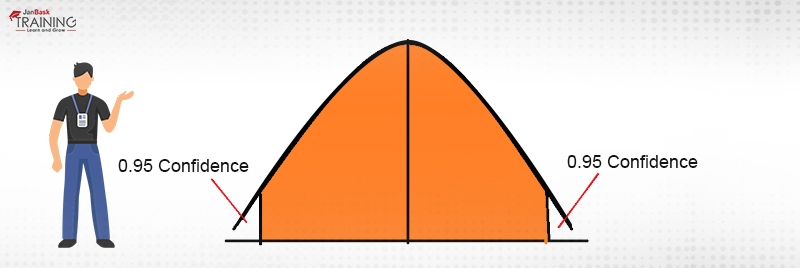
Though the concept of the confidence interval and confidence level are intrinsically linked, they still are different concepts in the domain of statistics whereas in slang language that can still be used interchangeably. Usually, confidence intervals are depicted in percentage terms whereas confidence intervals are sheer numbers. For example, if a survey of lactating mothers is conducted to have an estimate of the number of diapers purchased by each one of them. The results yield a confidence level of 95% and we get a confidence interval of (100,200). This would mean that a lactating mother on an average buys diapers somewhere between 100 and 200 and this could be true for 95% times. Diagrammatically, it is being displayed in Fig. 1.
How to calculate the confidence interval for a population with a known standard deviation:
One of the methods to compute the confidence interval is the use of error bound method. The other being the use of a central limit theorem. In this blog, we’ll be using the error bound method. This method gets its name from the fact that it gives the boundary of the interval as obtained from the standard deviation making its application a bit more straightforward. To compute the interval for a population with mean ?, where the standard deviation of the population is known, x and the margin of error is required. IN this case, the margin of error (EBM) is called the error bound for the population.
The mathematical formulation for margin of error is as:
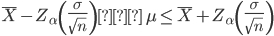
The margin of error depends upon the confidence level (CL) which is to be achieved. depicts the probability that an unknown population parameter is not contained in the confidence level.
Mathematically,
 =1-CL
=1-CL
For a population with known standard deviation, the confidence interval is based upon the assumption that sampling distribution follows approximately a normal distribution.
To achieve a confidence interval of 95% of the probability distribution, 95% of the area under the curve should be computed. I.e. one should leave a 2.5% area on the tails. This for a distribution whose mean is 10 and distribution is normal would like as in Figure 2:
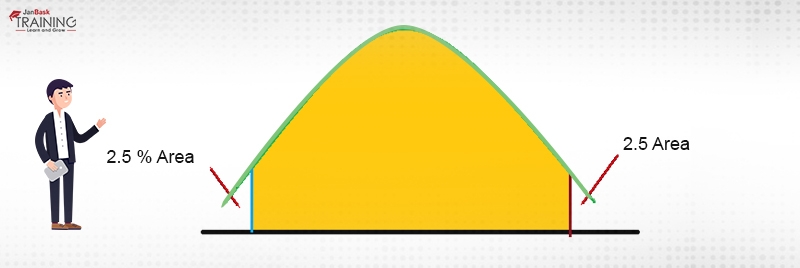 Figure 2: area under the curve
Steps for calculating the confidence interval using the Error Bound Method:
Example:
Let us say that we are interested in finding the mean scores on an examination. Now, a random sample of 40 scores is taken and mean for which is 68 and the standard deviation is 3. Here, the point of interest is to find the confidence interval with 95?curacy.
So,
To calculate the confidence interval, the sample mean is an error bound is required.


=> 
=>
Thus, the left area is  is 0.025 and right are is 0.095
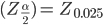
Using the probability distribution table for the standard normal distribution we can infer that for a normal distribution the value of z for this case is 1.96.
Thus, my error bound, EBM = 1.96*( ) = 12.397
EBM = 0.93
Lower bound = 68 – 0.93 = 67.07
Upper bound = 68 + 0.93 = 68.93
Thus, 95% confidence interval is (67.07, 68.93)
While doing statistics over a dataset, the standard deviation of the same is rarely known. Thus, the method as described in the previous section is seldom used. But, unknown standard deviation had never been an issue, owing to the large sizes of datasets from which the standard deviation was calculated making way for calculation of confidence interval. But if the dataset had fewer observations, the final was never good enough to be trusted.
This problem was faced by William S. Gosset of Guinness brewery in Dublin when he was experimenting with hops and barley and generated very few observations. While performing the experimentation, he realized that normal distribution was not the ideal way of calculating the confidence interval. This problem resulted in the genesis of the student’s t-distribution.
The student’s t-distribution is the symmetrical curve. It's different from a normal distribution in the sense that its flat over the x-axis and hence, can take a larger number of standard deviations to capture the same amount of area under the curve. In reality, there can be an infinite number of students t curve which can be achieved by altering the number of samples. With the increase in sample size, the t-distribution takes the shape of a normal curve and with fewer samples, it flattens towards the x-axis. The relationship between normal distribution and t-distribution can be depicted as in figure 3.

Figure 3: Relationship (source:openstax.org)
Developing the student t-distribution:
Step 1: Calculate t using the following formula:

Where Z is the standard normal distribution and x2 is the chi-squared distribution with v degree of freedom.
Step 2: By Substituting the numerator and denominator with expanded values we get:
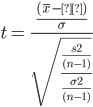
Step 3:
Finally, for v = n-1, this equation becomes:

Reiterating the confidence interval formula for the mean for scenarios where sample size is less than 30 and standard deviation is unknown, the confidence interval becomes:
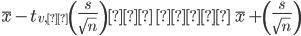
Here the point estimate of the population standard deviation, s has been substituted for the population standard deviation, ?, and t?,? has been substituted for Z?.
V represents the degree of freedom of the distribution and varies according to the size of sample.
A number of types of estimates are compounded from the statistics of a dataset. One of them which shows the level of certainty in talk is called confidence interval. It proposes a range of values to which an unknown parameter belongs. This is associated with the confidence level that the proposed parameter is in the range.
Please leave the query and comments in the comment section.
 FaceBook
 Twitter
 LinkedIn
 Pinterest
 Email
Email
The JanBask Training Team includes certified professionals and expert writers dedicated to helping learners navigate their career journeys in QA, Cybersecurity, Salesforce, and more. Each article is carefully researched and reviewed to ensure quality and relevance.


Cyber Security

QA

Salesforce

Business Analyst

MS SQL Server

Data Science

DevOps

Hadoop

Python

Artificial Intelligence

Machine Learning

Tableau
Search Posts
Related Posts
Receive Latest Materials and Offers on Data Science Course
Interviews


 Jan 22, 2020
 5.8k
5.8k

 5.8k
5.8k